Fig. 2.
Download original image
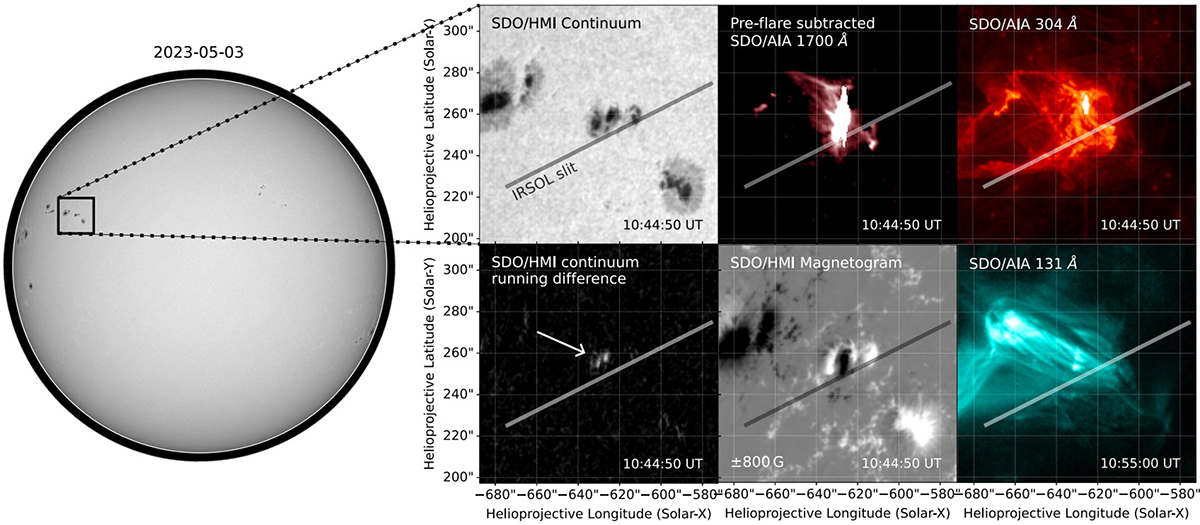
Location and morphology of the 3 May 2023 M7 event. Left panel: Location on the solar disk. Right panel: Context images showing (left to right, top to bottom) SDO/HMI continuum, SDO/AIA 1700 Å (pre-flare subtracted, see Sect. 3.3), SDO/AIA 304 Å, SDO/HMI continuum running differences (see Eq. (2)), SDO/HMI magnetogram, and SDO/AIA 131 Å. All of the images were taken at the time of the GOES X-ray flux peak, except SDO/AIA 131 Å, which was taken about 10 minutes after.
Current usage metrics show cumulative count of Article Views (full-text article views including HTML views, PDF and ePub downloads, according to the available data) and Abstracts Views on Vision4Press platform.
Data correspond to usage on the plateform after 2015. The current usage metrics is available 48-96 hours after online publication and is updated daily on week days.
Initial download of the metrics may take a while.