Fig. 3.
Download original image
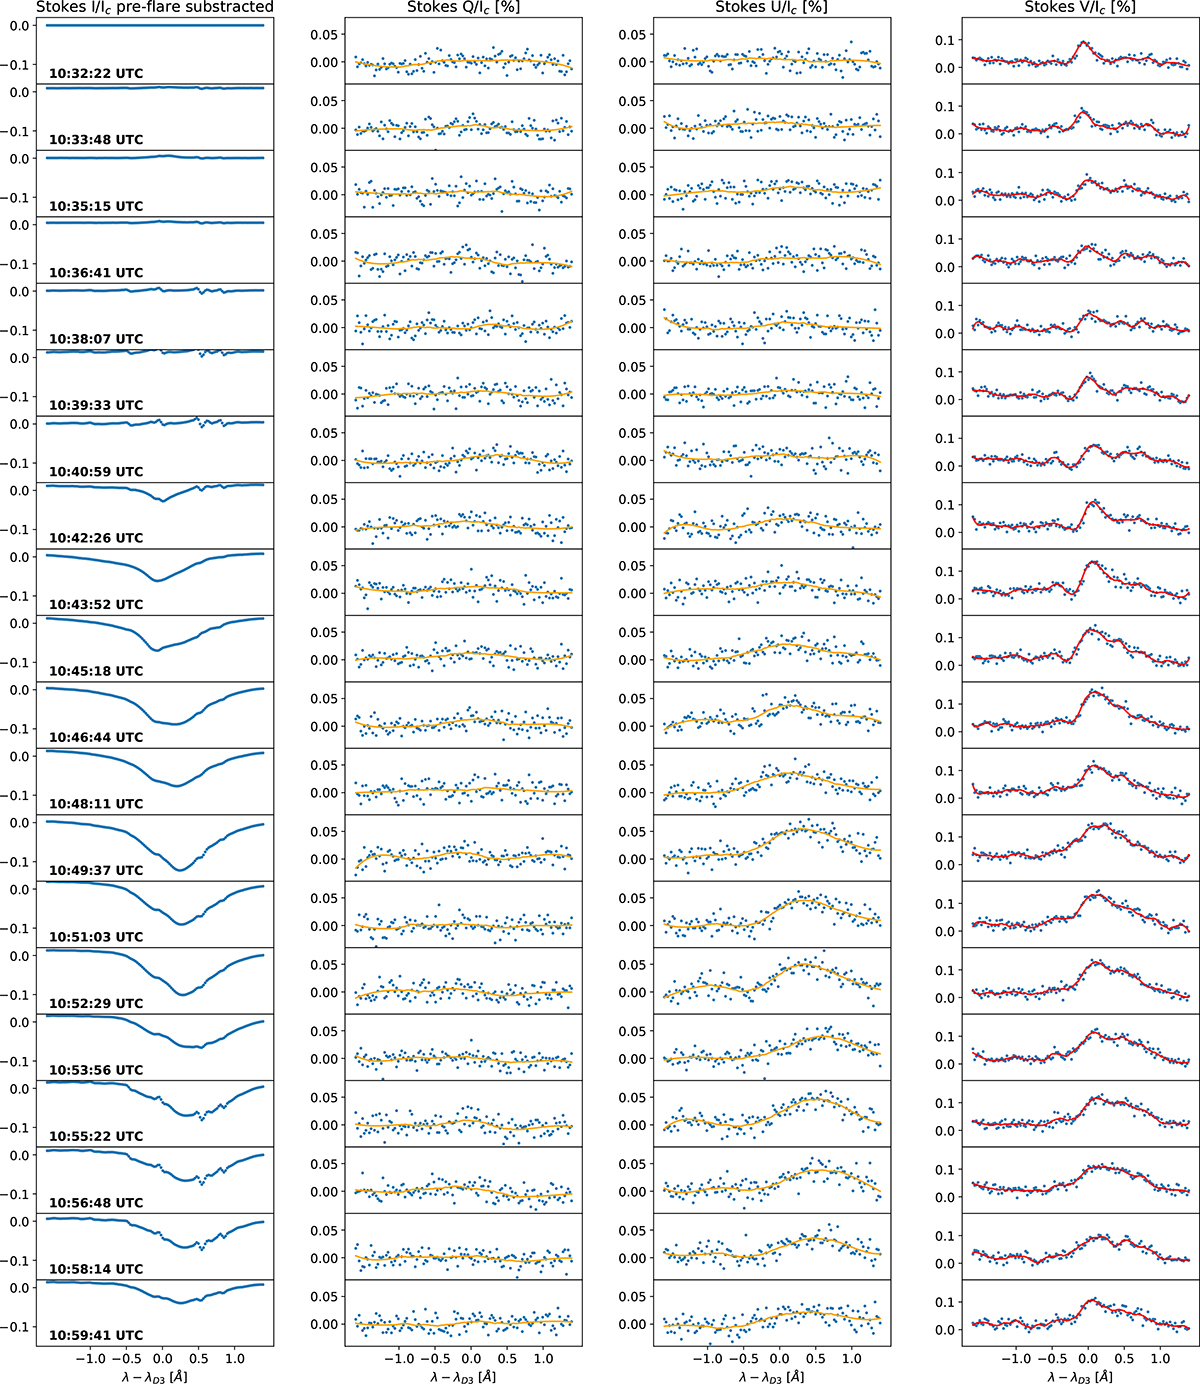
Time evolution of the Stokes signals for the 3 May 2023 M7 event. From left to right, we show the I/Ic (pre-flare subtracted, see Sect. 3.1), Q/Ic, U/Ic, and V/Ic Stokes spectra averaged along the slit at each time frame of the observation, with λD3 = 5875.6 Å. We overplot the Savitzky-Golay smoothing of data points for Q/Ic and U/Ic (orange curves), and for V/Ic (red curves).
Current usage metrics show cumulative count of Article Views (full-text article views including HTML views, PDF and ePub downloads, according to the available data) and Abstracts Views on Vision4Press platform.
Data correspond to usage on the plateform after 2015. The current usage metrics is available 48-96 hours after online publication and is updated daily on week days.
Initial download of the metrics may take a while.