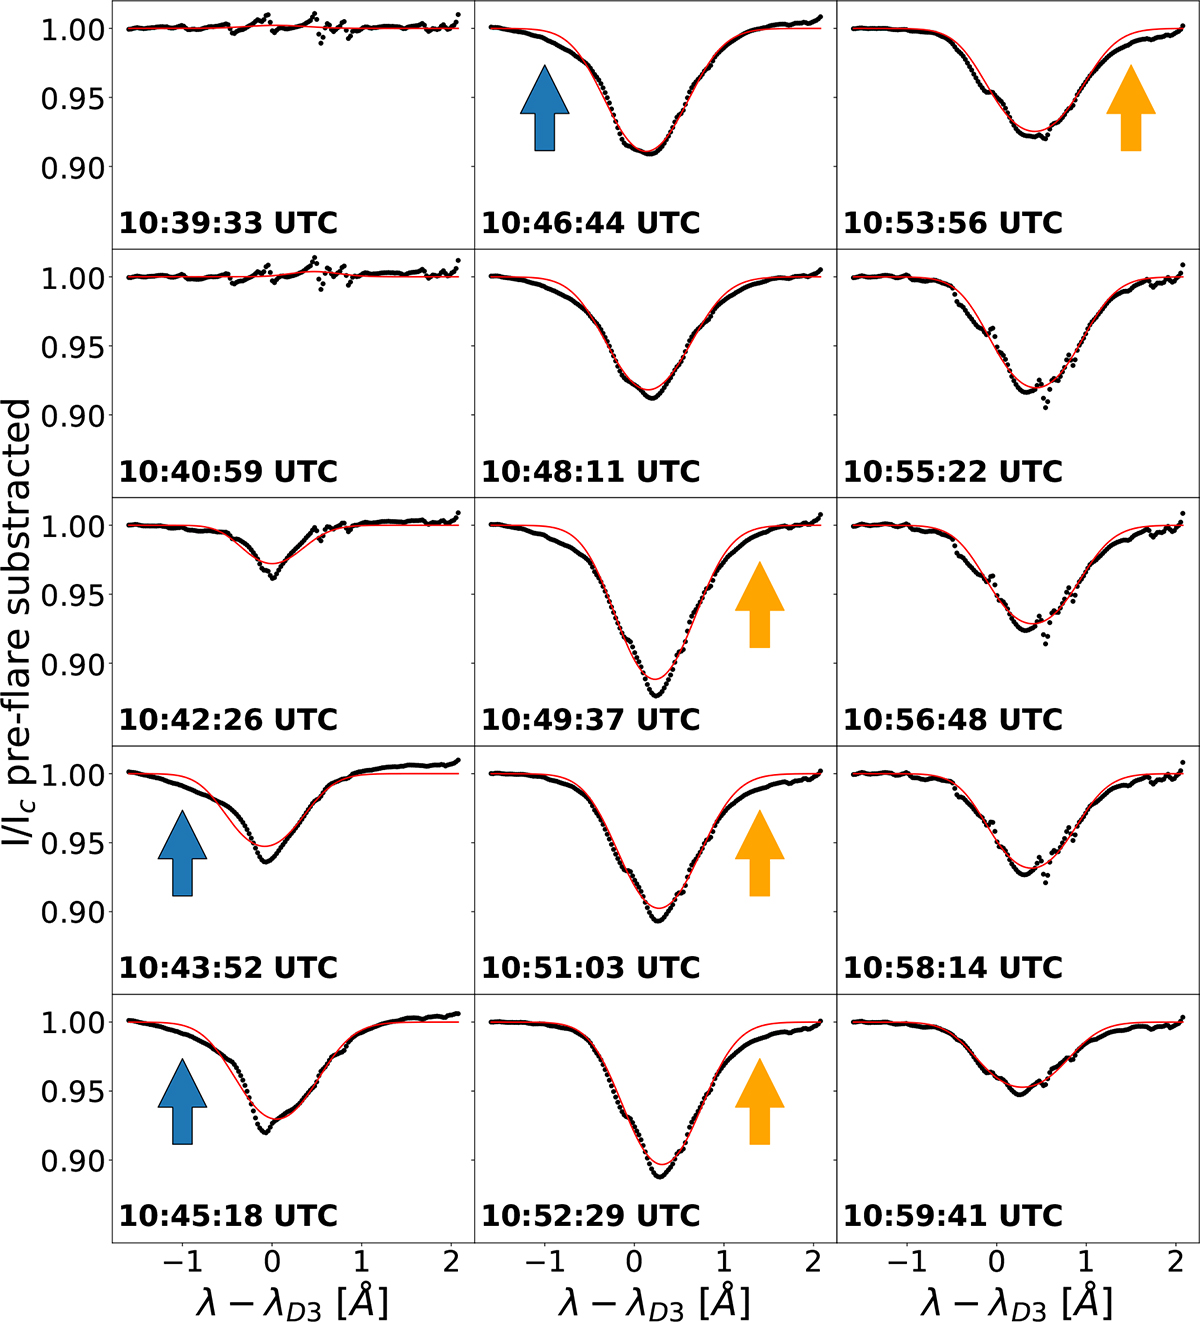
Fig. 4.
Download original image
Time series of measured I/Ic spectra (black dots) and the corresponding HaZeL fit (red lines) for the 3 May 2023 M7 event. Each image was processed by subtracting the chronologically first frame (10:33 UT, not shown here). The blue and orange arrows indicate small discrepancies in the fit that might indicate the need to include in the modeling fainter components, blueshifted or redshifted, respectively, relative to the main component.
Current usage metrics show cumulative count of Article Views (full-text article views including HTML views, PDF and ePub downloads, according to the available data) and Abstracts Views on Vision4Press platform.
Data correspond to usage on the plateform after 2015. The current usage metrics is available 48-96 hours after online publication and is updated daily on week days.
Initial download of the metrics may take a while.