Fig. 6.
Download original image
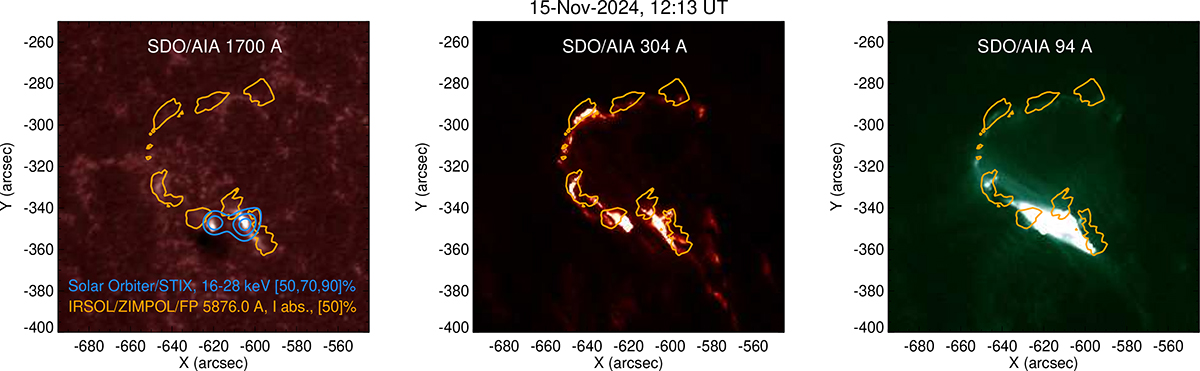
Comparison of SDO/AIA maps with STIX and ZIMPOL Fabry-Pérot observations. The orange contours represent the 50% of the maximum Stokes I in the ZIMPOL observations of the 15 November 2024 M1 event during the impulsive phase using the Fabry-Pérot setup. For context, from left to right we show the SDO/AIA 1700 Å (WL emission), SDO/AIA 304 Å (flare ribbons), and SDO/AIA 94 Å (flare loop) maps. The blue contours represent the STIX HXR images, indicating the electron precipitation sites, which are co-spatial with the WL emission in the SDO/AIA 1700 Å map.
Current usage metrics show cumulative count of Article Views (full-text article views including HTML views, PDF and ePub downloads, according to the available data) and Abstracts Views on Vision4Press platform.
Data correspond to usage on the plateform after 2015. The current usage metrics is available 48-96 hours after online publication and is updated daily on week days.
Initial download of the metrics may take a while.