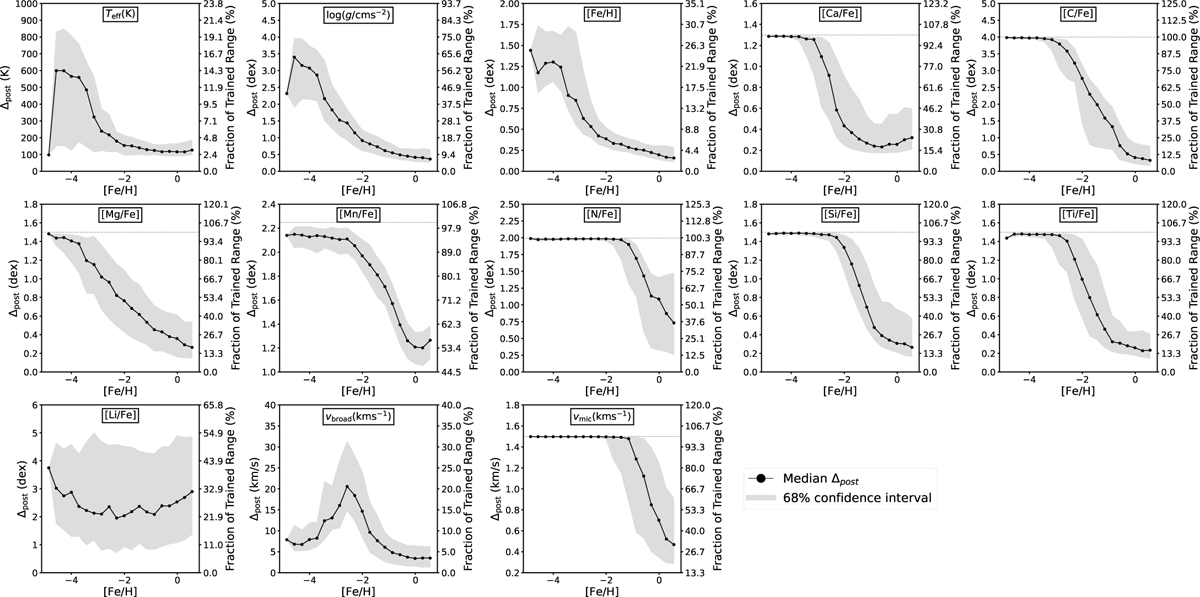
Fig. A.3
Download original image
Overview of the median total width of the predicted posteriors for the individual components as a function of [Fe/H] for S/N=250 Å−1 on the synthetic test spectra. They grey shaded region indicates the 68% confidence interval. The horizontal dashed line, indicates a full posterior width that corresponds to 100% of the parameter range in the training set.
Current usage metrics show cumulative count of Article Views (full-text article views including HTML views, PDF and ePub downloads, according to the available data) and Abstracts Views on Vision4Press platform.
Data correspond to usage on the plateform after 2015. The current usage metrics is available 48-96 hours after online publication and is updated daily on week days.
Initial download of the metrics may take a while.