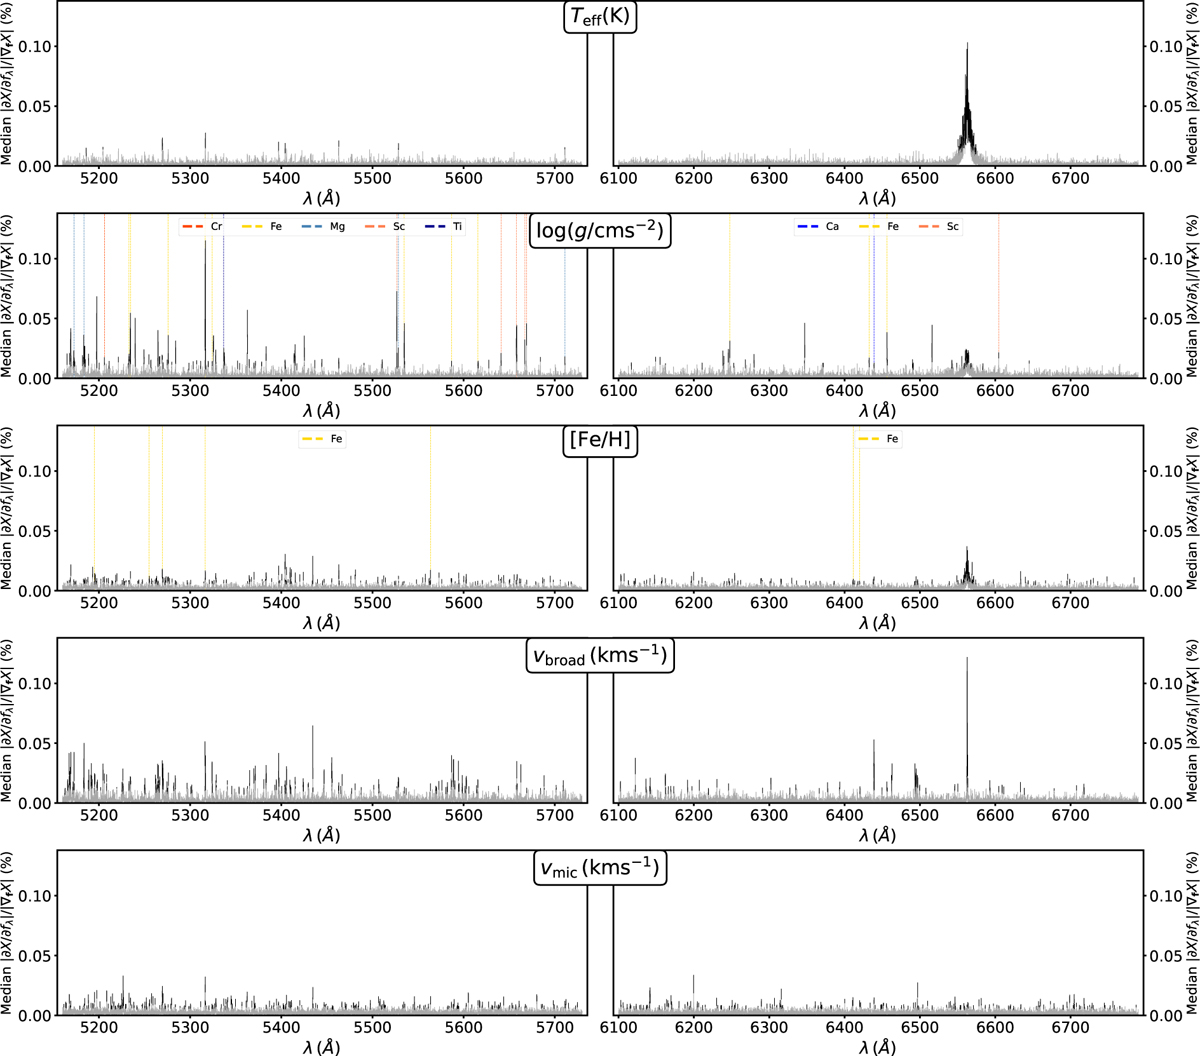
Fig. A.4
Download original image
Average feature importance in the cINN for the primary stellar properties. Shown is the median relative contribution of each flux bin to the total gradient of each target parameter with respect to the total flux vector averaged over a synthetic test set with S/N=250 Å−1. Black lines indicate flux bins whose median contribution is larger than the mean by more than 3 σ. In each row, the left panel shows the green 4MOST window, while the right panel presents the red window. The dashed lines in the log (g) and [Fe/H] panels indicate common diagnostic absorption lines of various elements that coincide with a peak in the feature importance.
Current usage metrics show cumulative count of Article Views (full-text article views including HTML views, PDF and ePub downloads, according to the available data) and Abstracts Views on Vision4Press platform.
Data correspond to usage on the plateform after 2015. The current usage metrics is available 48-96 hours after online publication and is updated daily on week days.
Initial download of the metrics may take a while.