Fig. 3
Download original image
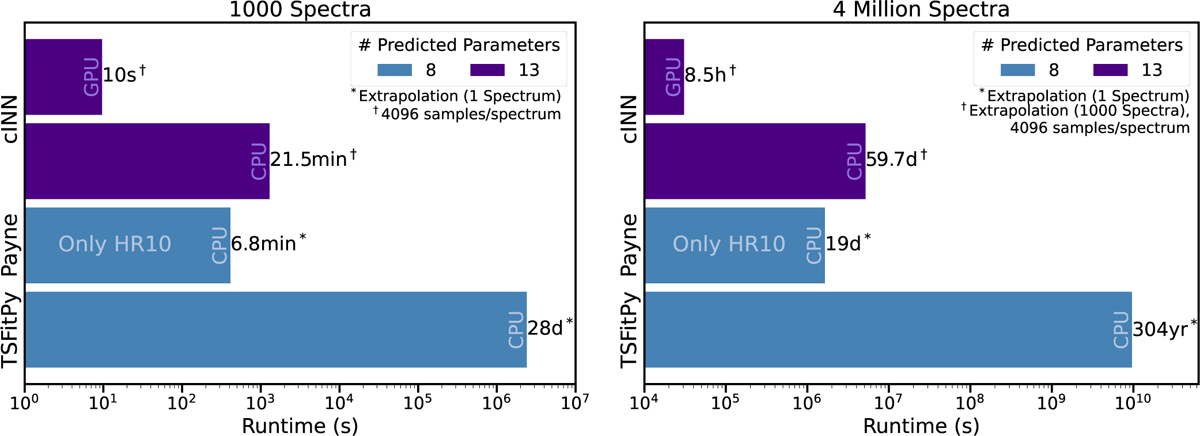
Runtime comparison between the proposed cINN approach to the previously established methods TSFitPy and the Payne. The performance of the cINN was measured for the case of generating 4096 posteriors samples per spectrum, using one core of an AMD EPYC 9554 P (3.7 GHz) CPU and an NVIDIA RTX 6000 Ada GPU, respectively. The total cINN runtime is a combination of posterior generation and subsequent point estimation, but the latter becomes negligible quickly. We note that the runtimes in the right panel are extrapolated from the 1000 spectra (cINN) and 1 spectrum (TSFitPy and Payne) results, respectively. The Payne approach shown here operates on a more limited input parameter space, denoted as HR10, which covers the wavelength range from 534 to 562 nm and is based on the set-up of the GIRAFFE spectrograph.
Current usage metrics show cumulative count of Article Views (full-text article views including HTML views, PDF and ePub downloads, according to the available data) and Abstracts Views on Vision4Press platform.
Data correspond to usage on the plateform after 2015. The current usage metrics is available 48-96 hours after online publication and is updated daily on week days.
Initial download of the metrics may take a while.