Fig. 4
Download original image
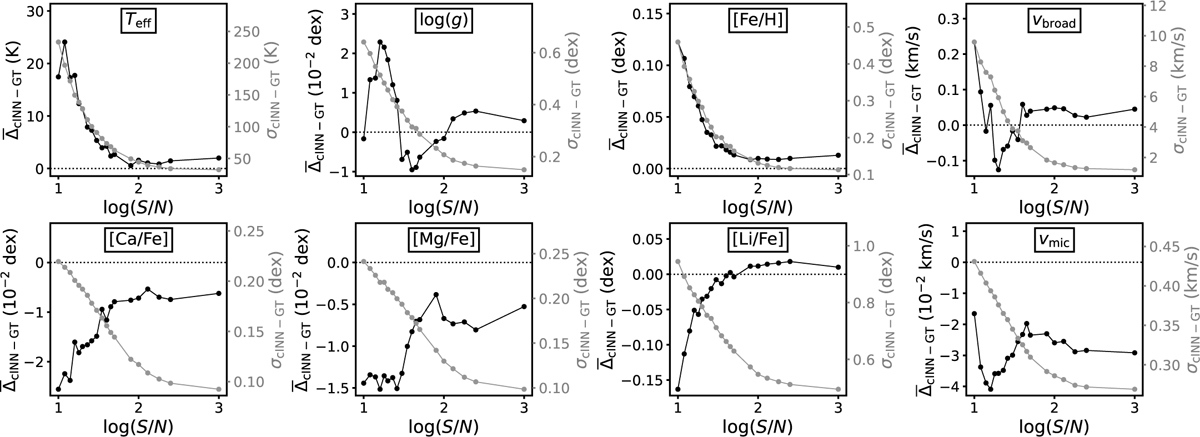
Summary of cINN performance on synthetic spectra as a function of S/N. In each panel, the mean residual ![]() is plotted in black on the left y-axis scale, while the standard deviation σcINN–GT is indicated in grey and plotted on the right y-axis scale. The black dotted line indicates, where
is plotted in black on the left y-axis scale, while the standard deviation σcINN–GT is indicated in grey and plotted on the right y-axis scale. The black dotted line indicates, where ![]() for reference. For more details, see Table A.1 and Fig. A.1.
for reference. For more details, see Table A.1 and Fig. A.1.
Current usage metrics show cumulative count of Article Views (full-text article views including HTML views, PDF and ePub downloads, according to the available data) and Abstracts Views on Vision4Press platform.
Data correspond to usage on the plateform after 2015. The current usage metrics is available 48-96 hours after online publication and is updated daily on week days.
Initial download of the metrics may take a while.