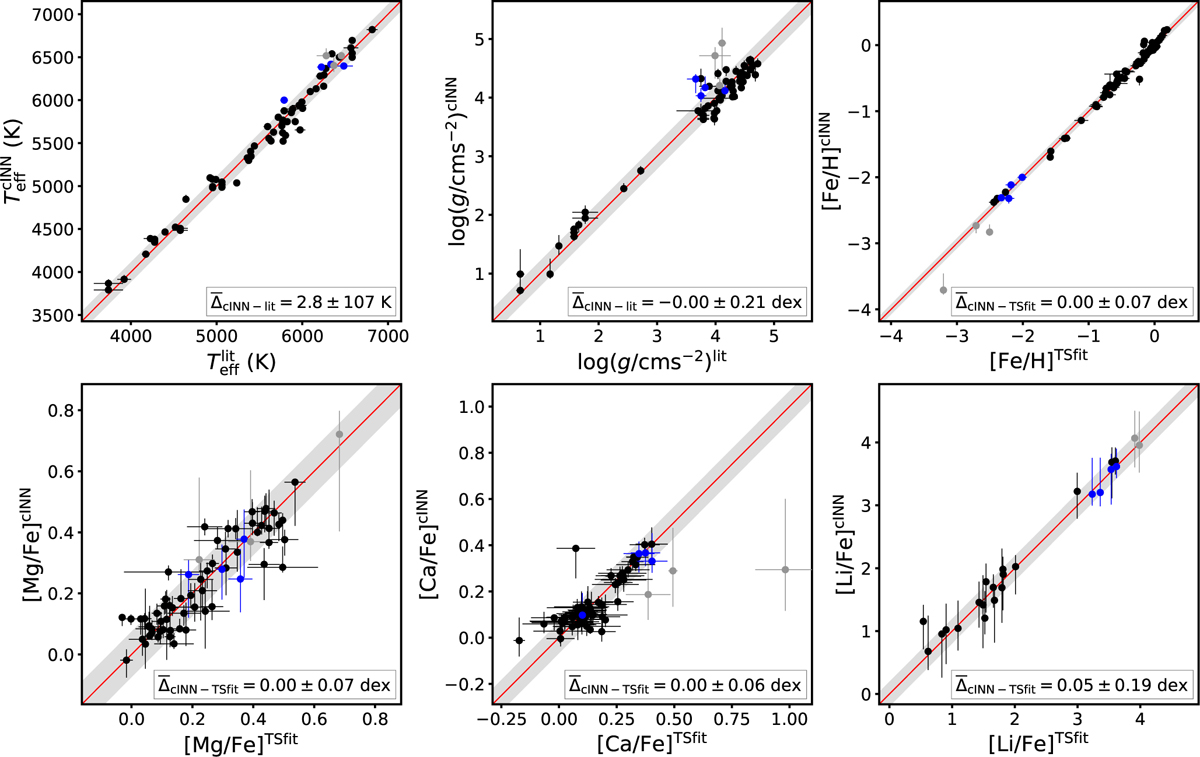
Fig. 6
Download original image
Comparison of cINN predictions after correction for systematic biases to the literature stellar parameters (Xlit) and abundance fits with Turbospectrum (XTSfit) for the real benchmark spectra listed in Table B.1. We note that some stars have multiple spectra in our benchmark set. For some spectra, there are no uncertainties listed in the literature for Teff and log(g), so no x-error bars are displayed in these cases (see Table B.1). The Teff uncertainties are often too small to be visible in the top left panel. The y-error bars indicate the 1D 68% confidence intervals determined from the predicted posterior distributions. Stars indicated in grey have [Fe/H] ≤−2.5 and were not considered in the fit for the bias correction (but are corrected here). The grey shaded area around the 1-to-1 correlation represents the 1 σ standard deviation of the residuals of the MAP estimate with respect to the reference value XcINN,MAP−Xlit/TSfit. The stars highlighted in blue correspond to the example stars shown in Figs. 7 and B.2.
Current usage metrics show cumulative count of Article Views (full-text article views including HTML views, PDF and ePub downloads, according to the available data) and Abstracts Views on Vision4Press platform.
Data correspond to usage on the plateform after 2015. The current usage metrics is available 48-96 hours after online publication and is updated daily on week days.
Initial download of the metrics may take a while.