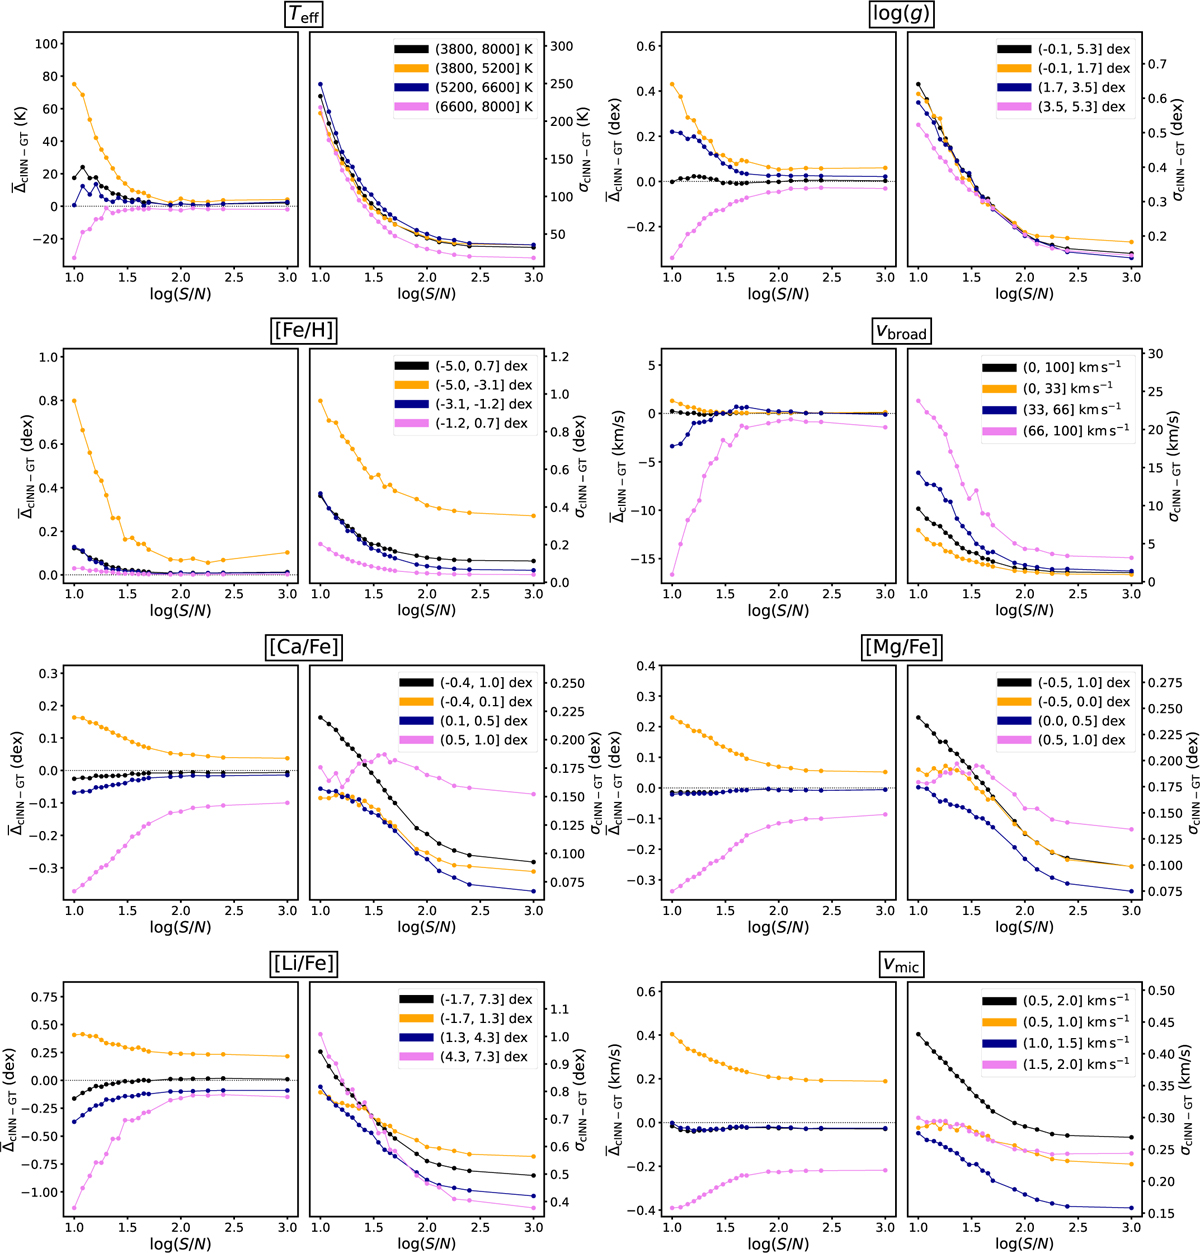
Fig. A.1
Download original image
Summary of cINN performance of synthetic spectra as a function of S/N. Expanding upon Fig. 4, shown is a detailed breakdown of the mean residual ![]() and standard deviation σcINN–GT of each target parameter, distinguishing the lower third (orange), middle third (dark blue), and upper third (violet) of the respective range in the test data. For comparison, the black line shows the respective results over the full trained parameter range. The black dotted line indicates DcINN–GT = 0 for reference.
and standard deviation σcINN–GT of each target parameter, distinguishing the lower third (orange), middle third (dark blue), and upper third (violet) of the respective range in the test data. For comparison, the black line shows the respective results over the full trained parameter range. The black dotted line indicates DcINN–GT = 0 for reference.
Current usage metrics show cumulative count of Article Views (full-text article views including HTML views, PDF and ePub downloads, according to the available data) and Abstracts Views on Vision4Press platform.
Data correspond to usage on the plateform after 2015. The current usage metrics is available 48-96 hours after online publication and is updated daily on week days.
Initial download of the metrics may take a while.