Fig. A.1.
Download original image
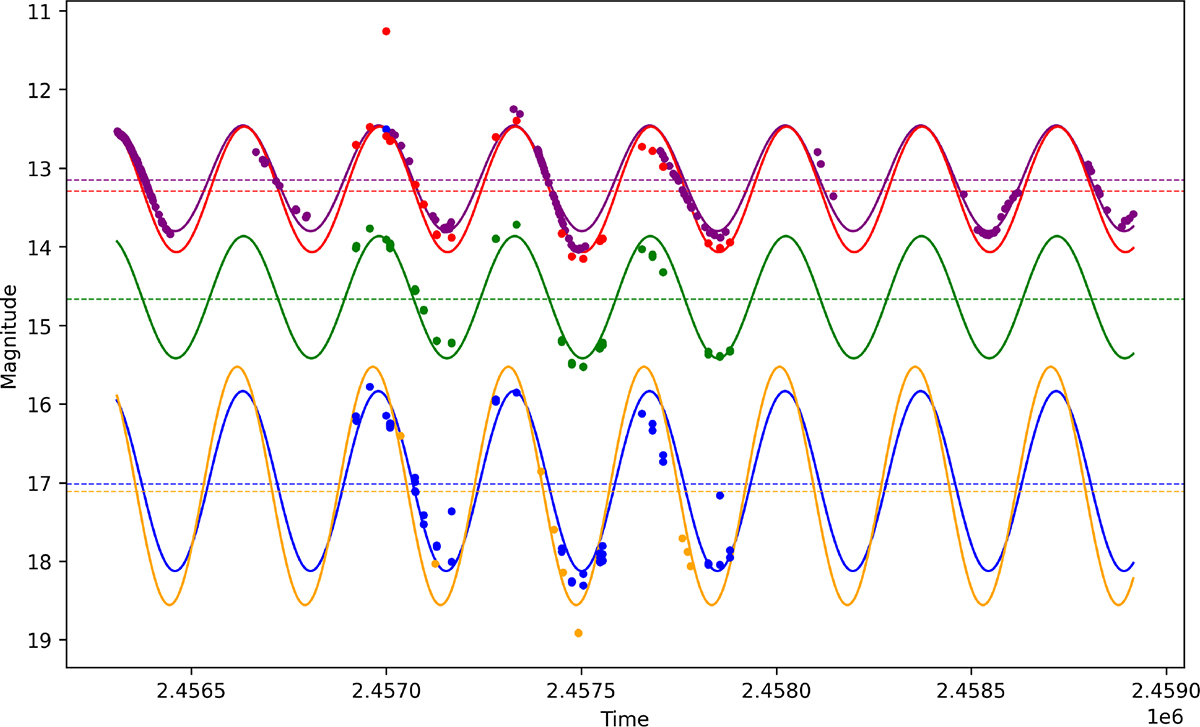
Observed multi-band and multi-period photometry for the star Gaia DR3 2935152926080940544 with the best-fit light curve models. The points represent the observed magnitudes, and the curves represent the best-fit light curve for each photometry band. The horizontal dashed lines are the mean magnitudes for each best-fit model of each band. To create the multi-band light curve model for this star, we used OGLE bands I (purple) and V (yellow), and Gaia bands G (green), BP (blue), and RP (red).
Current usage metrics show cumulative count of Article Views (full-text article views including HTML views, PDF and ePub downloads, according to the available data) and Abstracts Views on Vision4Press platform.
Data correspond to usage on the plateform after 2015. The current usage metrics is available 48-96 hours after online publication and is updated daily on week days.
Initial download of the metrics may take a while.