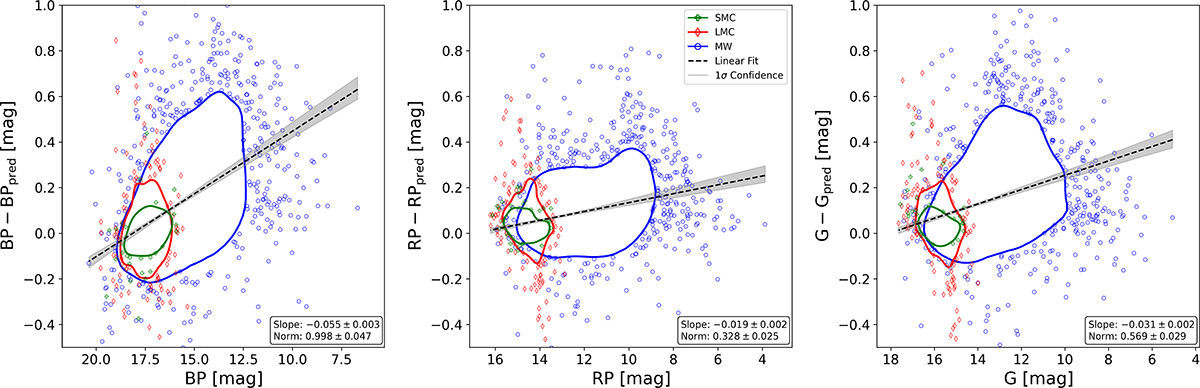
Fig. 2.
Download original image
Absolute difference between the un-reddened GaiaBP, RP, and G magnitudes and our mean magnitudes derived from the light curve fit. The colours are the same as in Fig. 1. The y-axis range is restricted to highlight the region of interest, excluding a few outliers. The dashed black line shows the linear fit, and the shaded region denotes the 1σ confidence interval of the regression. The resulting fit parameters (slope and intercept) and their uncertainties are reported within each panel.
Current usage metrics show cumulative count of Article Views (full-text article views including HTML views, PDF and ePub downloads, according to the available data) and Abstracts Views on Vision4Press platform.
Data correspond to usage on the plateform after 2015. The current usage metrics is available 48-96 hours after online publication and is updated daily on week days.
Initial download of the metrics may take a while.