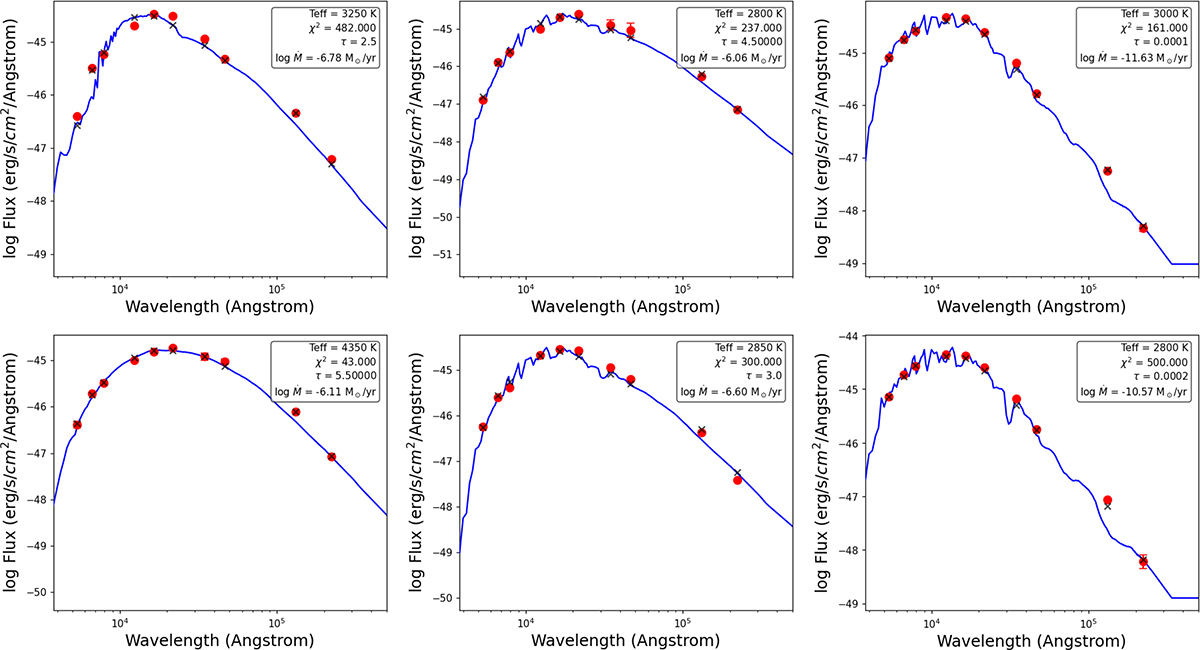
Fig. 3.
Download original image
Examples of SED fits for six stars with different stellar and dust parameters. The red points indicate the observed fluxes normalized to the stellar luminosity, the blue line shows the best-fitting model, and the small black crosses represent the model fluxes convolved with the observational filter transmission curves, which are the quantities used in the SED fitting.
Current usage metrics show cumulative count of Article Views (full-text article views including HTML views, PDF and ePub downloads, according to the available data) and Abstracts Views on Vision4Press platform.
Data correspond to usage on the plateform after 2015. The current usage metrics is available 48-96 hours after online publication and is updated daily on week days.
Initial download of the metrics may take a while.