Open Access
Fig. 6.
Download original image
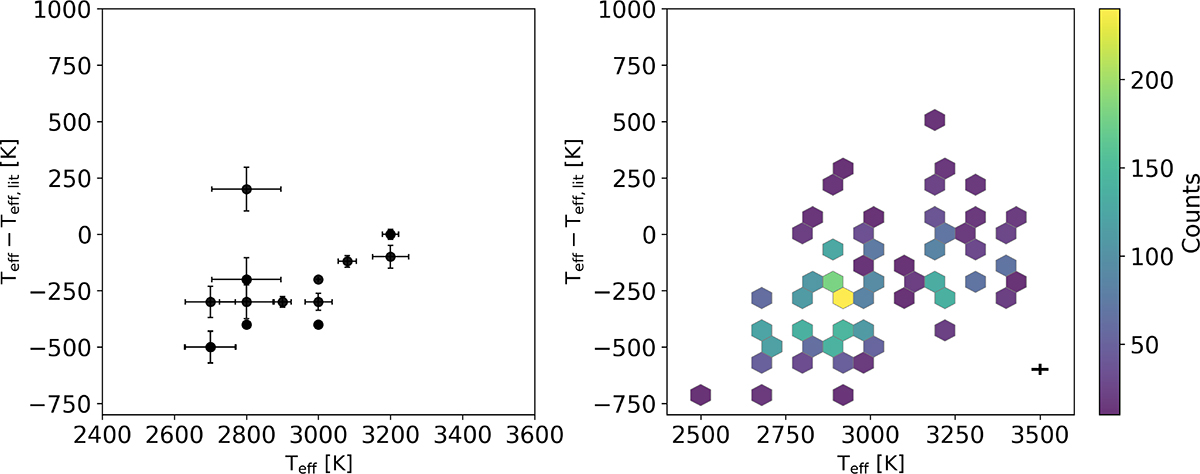
Comparison of the effective temperature values for the common sources between our work and those by Groenewegen et al. (2009) and Groenewegen & Sloan (2018) (left diagram) and Riebel et al. (2012) (right diagram). The data are shown using hexagonal density binning with a grid size of 40 and a threshold count of 10.
Current usage metrics show cumulative count of Article Views (full-text article views including HTML views, PDF and ePub downloads, according to the available data) and Abstracts Views on Vision4Press platform.
Data correspond to usage on the plateform after 2015. The current usage metrics is available 48-96 hours after online publication and is updated daily on week days.
Initial download of the metrics may take a while.