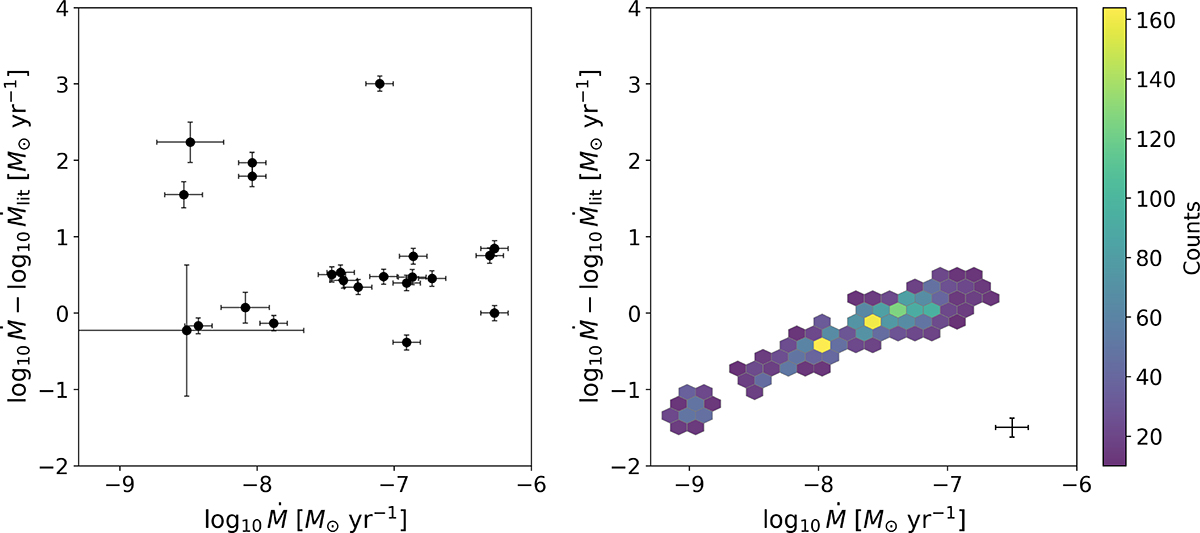
Fig. 7.
Download original image
Comparison of the gas mass-loss rate values for the common sources between our work and those by Groenewegen et al. (2009) and Groenewegen & Sloan (2018) (left diagram) and Riebel et al. (2012) (right diagram). The uncertainties plotted are only the ones derived in this study. The cross in the bottom right corner of the right panel represents the average uncertainty. We note that the average uncertainty depends on the mass-loss regime, as is clear in the left panel.
Current usage metrics show cumulative count of Article Views (full-text article views including HTML views, PDF and ePub downloads, according to the available data) and Abstracts Views on Vision4Press platform.
Data correspond to usage on the plateform after 2015. The current usage metrics is available 48-96 hours after online publication and is updated daily on week days.
Initial download of the metrics may take a while.