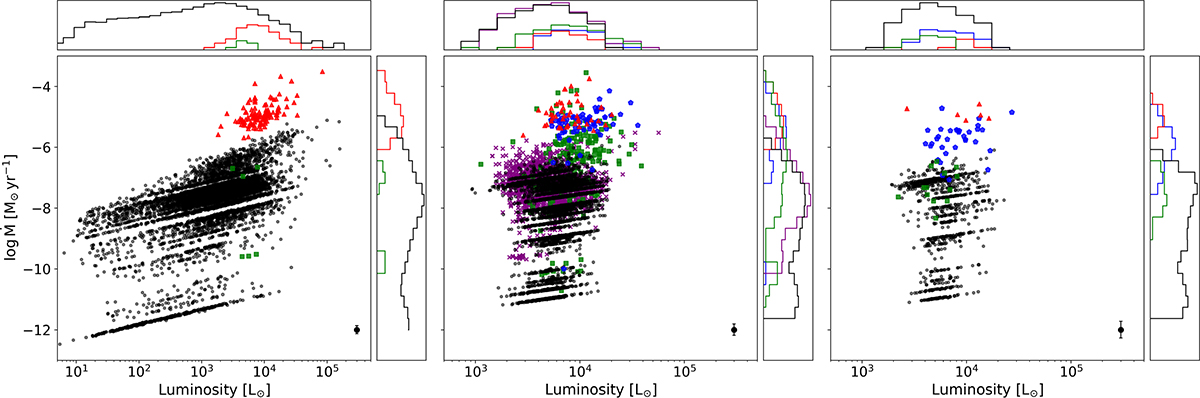
Fig. 8.
Download original image
From left to right: MW, LMC, and SMC stars. Luminosity against mass-loss rate values for stars in our sample (black dots), Groenewegen (2022, red triangles), Groenewegen et al. (2009, blue pentagons), Groenewegen & Sloan (2018, green squares), and Riebel et al. (2012, purple crosses). The black point in the bottom right corner of each panel represents the average uncertainty of our estimated mass-loss rates for each galaxy.
Current usage metrics show cumulative count of Article Views (full-text article views including HTML views, PDF and ePub downloads, according to the available data) and Abstracts Views on Vision4Press platform.
Data correspond to usage on the plateform after 2015. The current usage metrics is available 48-96 hours after online publication and is updated daily on week days.
Initial download of the metrics may take a while.