Fig. 9.
Download original image
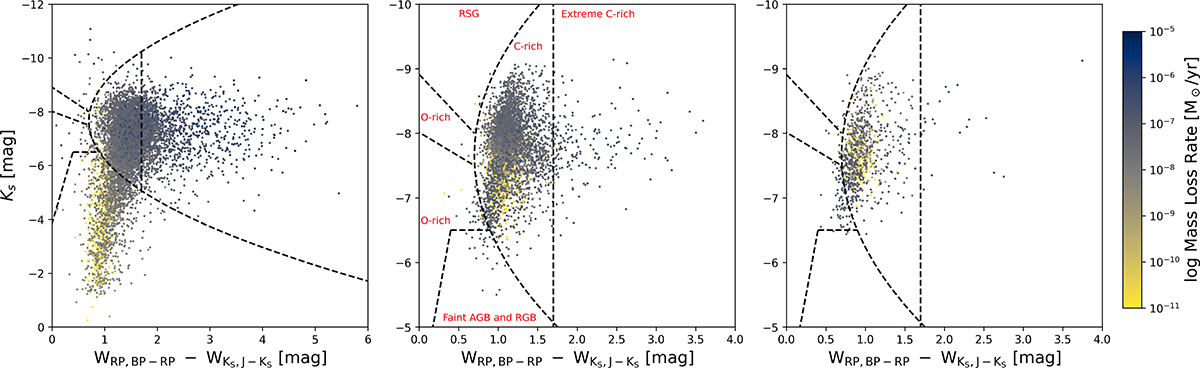
From left to right: MW, LMC, and SMC stars. Gaia-2MASS diagram coloured by the optical depths τV values derived in our study. The dotted lines represent the observational-derived lines delimiting the different regions occupied by different types of AGB stars, and are defined as in Lebzelter et al. (2018). In the left panel, each region has been labelled accordingly with red text. The stars inside the C-rich region are the ones defined in this paper as C-region stars.
Current usage metrics show cumulative count of Article Views (full-text article views including HTML views, PDF and ePub downloads, according to the available data) and Abstracts Views on Vision4Press platform.
Data correspond to usage on the plateform after 2015. The current usage metrics is available 48-96 hours after online publication and is updated daily on week days.
Initial download of the metrics may take a while.