Fig. 1
Download original image
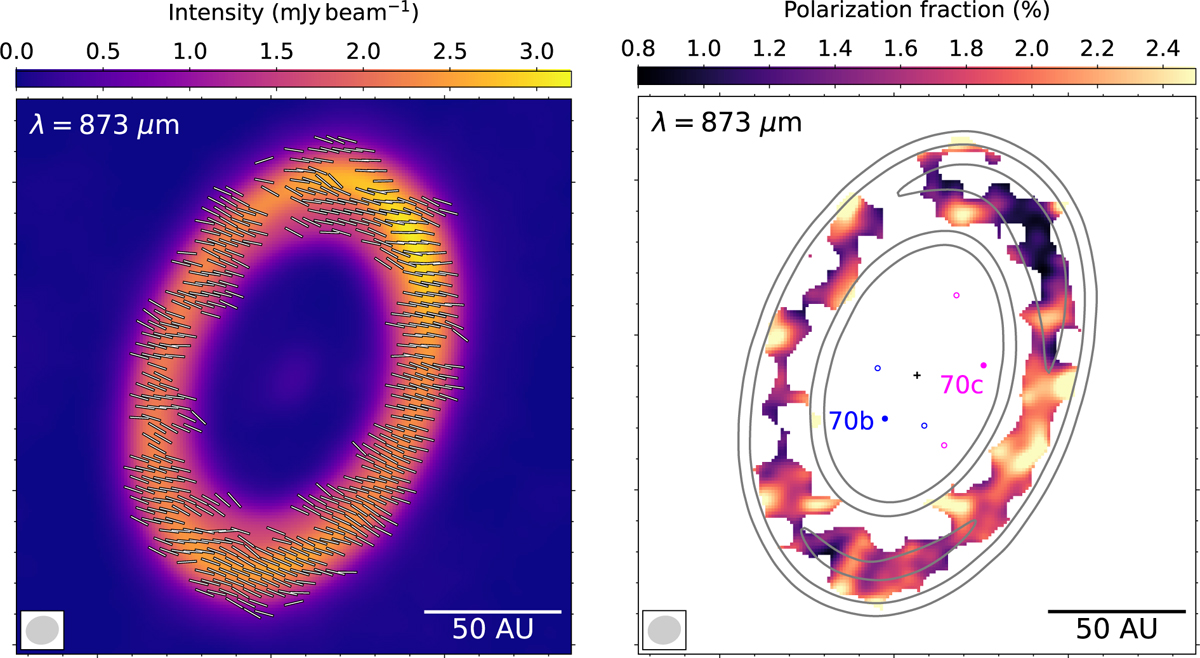
Full polarization images in 873 µm of PDS 70. Left panel: total intensity (color scale) and polarization position angles (line segments). Right panel: total intensity (contours) and the polarization fraction. Contour levels are 197 µJy beam−1 (5-σ) [3, 6, 12]. The cross symbol marks the location of the host star. Filled and open circles mark the locations of PDS 70b and 70c and their L4 and×L5 points. The synthesized beam is shown in the lower left.
Current usage metrics show cumulative count of Article Views (full-text article views including HTML views, PDF and ePub downloads, according to the available data) and Abstracts Views on Vision4Press platform.
Data correspond to usage on the plateform after 2015. The current usage metrics is available 48-96 hours after online publication and is updated daily on week days.
Initial download of the metrics may take a while.