Fig. 2
Download original image
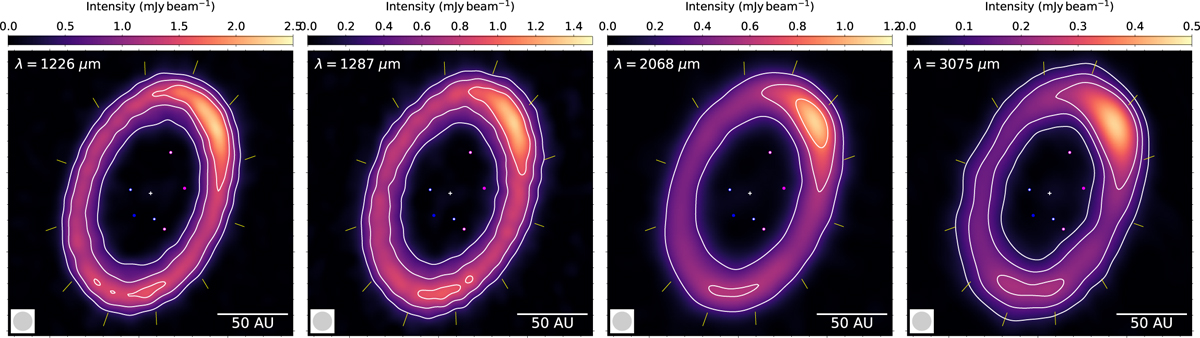
Total intensity images at 1226, 1287, 2068, and 3075 µm wavelengths. Contours for the λ = 1226 µm image are 81 µJy beam−1 (3-σ) [6, 12, 18]; contours for the λ =1287 µm image are 60 µJy beam−1 (3-σ) ×[5, 10, 15]; contours for the λ = 2068 µm image are 36 µJy beam−1 (3-σ) ×[8,16,24]; contours for the λ =3075 µm image are 18 µJy beam−1 (3-σ) ×[4,8,12]. Symbols are the same as those in Figure 1. Synthesized beams are shown in the lower left. Yellow line segments indicate the deprojected position angles starting from 0◦ (defined at the major axis in the northwest), with 30◦ intervals.
Current usage metrics show cumulative count of Article Views (full-text article views including HTML views, PDF and ePub downloads, according to the available data) and Abstracts Views on Vision4Press platform.
Data correspond to usage on the plateform after 2015. The current usage metrics is available 48-96 hours after online publication and is updated daily on week days.
Initial download of the metrics may take a while.