Fig. 3
Download original image
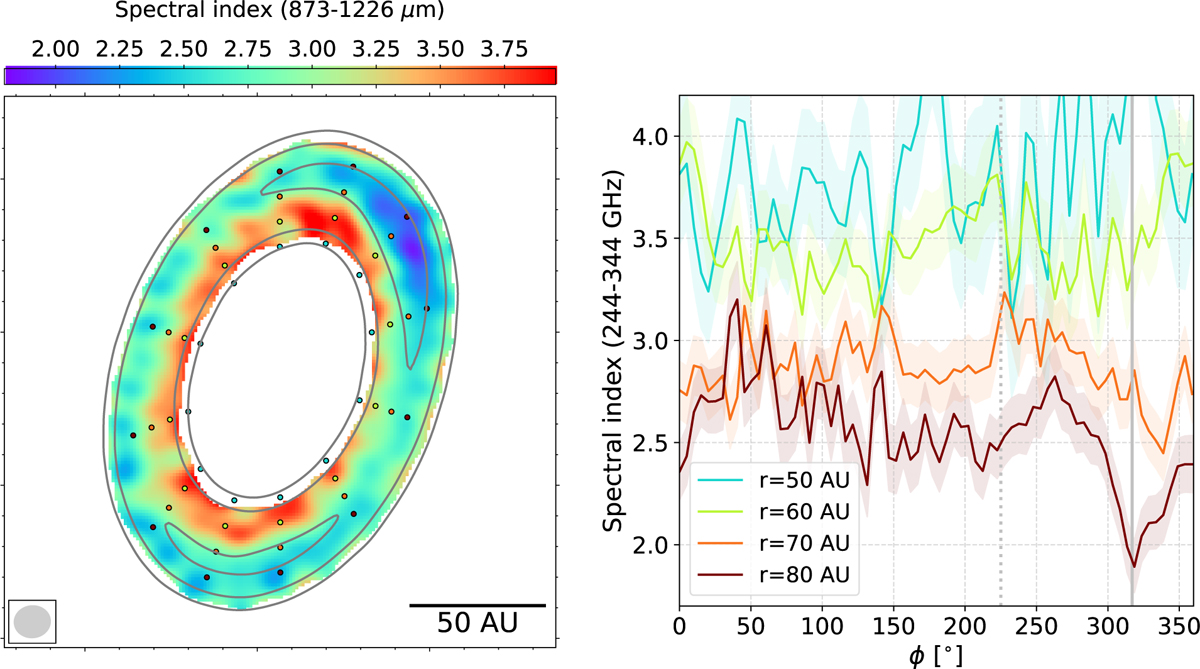
Spectral index at 873–1226 µm (αb6−b7). Left panel: color image of the spatially resolved distribution of αb6−b7. Contours are the same as those in the right panel of Figure 1. The circles (with 30◦ intervals in deprojected position angles) indicate the 50, 60, 70, and 80 AU deprojected radii. Right panel: values of αb6−b7 at 50, 60, 70, and 80 AU deprojected radii as functions of the deprojected position angle, ϕ.
Current usage metrics show cumulative count of Article Views (full-text article views including HTML views, PDF and ePub downloads, according to the available data) and Abstracts Views on Vision4Press platform.
Data correspond to usage on the plateform after 2015. The current usage metrics is available 48-96 hours after online publication and is updated daily on week days.
Initial download of the metrics may take a while.