Fig. 4
Download original image
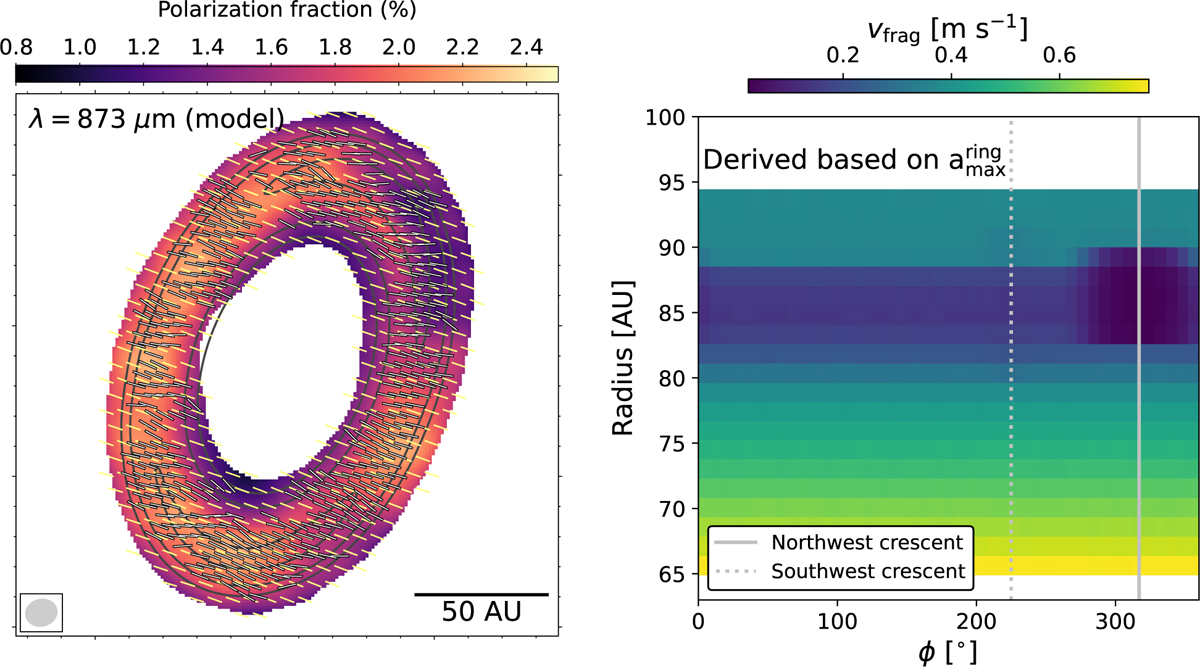
Physical properties derived from the fiducial radiative transfer model. Left panel: synthesized λ =873 µm images of total intensity (contours), polarization fraction (color), and polarization position angle (yellow line segments). We overplot the polarization position angles detected in actual observations (Figure 1). The angular resolution of these synthesized images are the same as those in Figure 1. Contour levels are 197 µJy beam−1 (5-σ) ×[3, 6, 12]. The synthesized beam is shown in the lower left. Right panel: fragmentation velocity (vfrag) based on the maximum dust grain sizes (amax) in the PDS 70 rings.
Current usage metrics show cumulative count of Article Views (full-text article views including HTML views, PDF and ePub downloads, according to the available data) and Abstracts Views on Vision4Press platform.
Data correspond to usage on the plateform after 2015. The current usage metrics is available 48-96 hours after online publication and is updated daily on week days.
Initial download of the metrics may take a while.