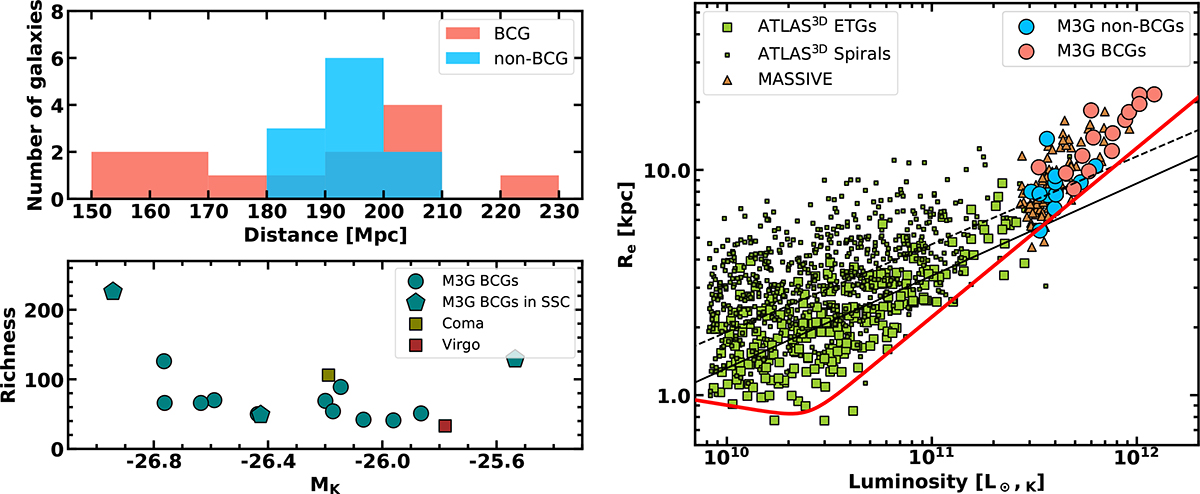
Fig. 1.
Download original image
Properties of the M3G sample. Top left: Histogram of the distances to the BCGs (orange) and the satellites galaxies (blue). Bottom left: Richness of the host galaxy cluster versus the absolute Ks magnitude of the corresponding BCG. BCGs in the SSC are shown as pentagrams (Abell 3558, Abell 3556 and Abell 3562 in order of decreasing brightness of the BCGs). The Virgo and Coma cluster (squares) have been added as references for the ATLAS3D and the MASSIVE Surveys. Right: Size–luminosity relation for the M3G sample galaxies, split into BCGs (red) and satellites (blue). Galaxies from two other surveys have been added for comparison: ETGs from the ATLAS3D survey (light green large squares), spirals from the ATLAS3D survey parent sample (dark green small squares), and ETGs from the MASSIVE survey (brown triangles). ATLAS3D sample is a magnitude-limited sample within 42 Mpc, while the galaxies in the MASSIVE are the brightest galaxies within 100 Mpc. The solid and dashed black lines are relations for fast rotators and S0-Sa galaxies from the ATLAS3D survey, respectively. The red line denotes the so-called ‘zone of avoidance’. All three relations are taken from Cappellari et al. (2011a).
Current usage metrics show cumulative count of Article Views (full-text article views including HTML views, PDF and ePub downloads, according to the available data) and Abstracts Views on Vision4Press platform.
Data correspond to usage on the plateform after 2015. The current usage metrics is available 48-96 hours after online publication and is updated daily on week days.
Initial download of the metrics may take a while.