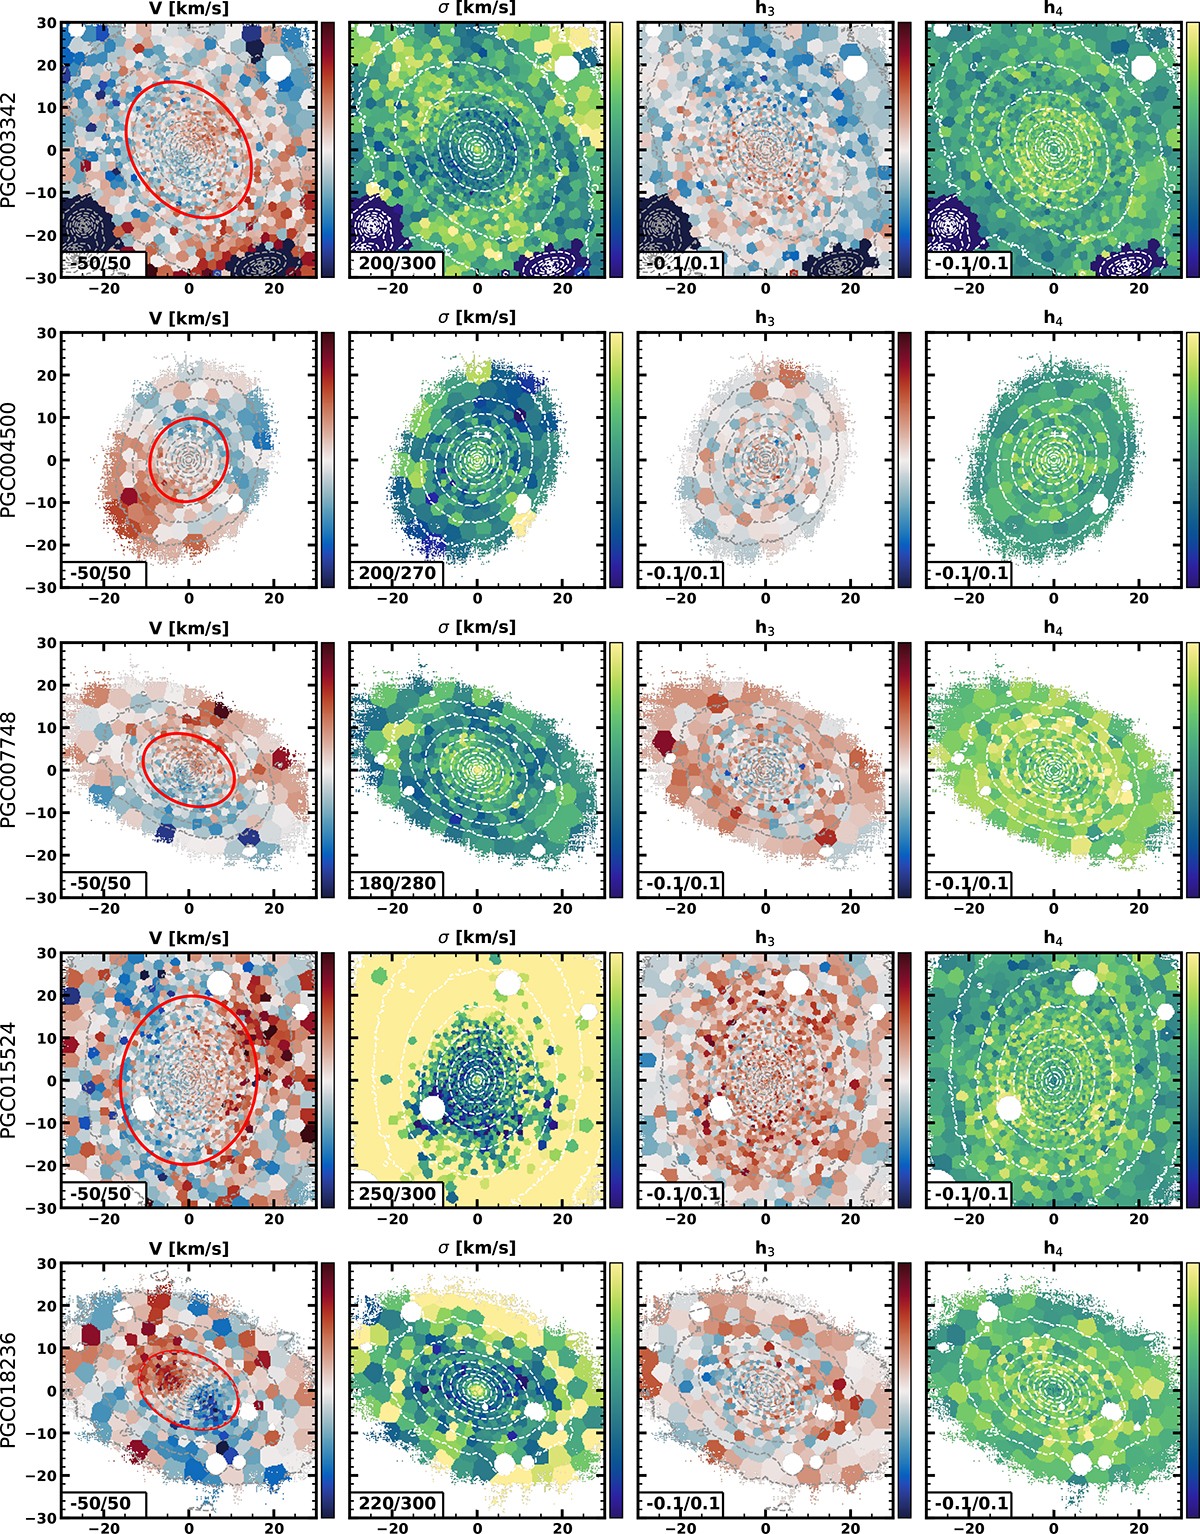
Fig. C.1.
Download original image
Kinematic maps of M3G galaxies. From left to right, the mean velocity, velocity dispersion, h3 and h4 moments are shown. The values (in kilometres per second for the mean velocity and velocity dispersion) in lower-left corners correspond to maximum and minimum of the colour bars on the right of each plot. The red ellipse has the major axis length equal to Re and the median flattening of the galaxy within the effective radius (see Table 1). It shows the elliptical aperture used to extract global effective properties (e.g. σe, λRe, average values of kinemetry parameters, etc).
Current usage metrics show cumulative count of Article Views (full-text article views including HTML views, PDF and ePub downloads, according to the available data) and Abstracts Views on Vision4Press platform.
Data correspond to usage on the plateform after 2015. The current usage metrics is available 48-96 hours after online publication and is updated daily on week days.
Initial download of the metrics may take a while.