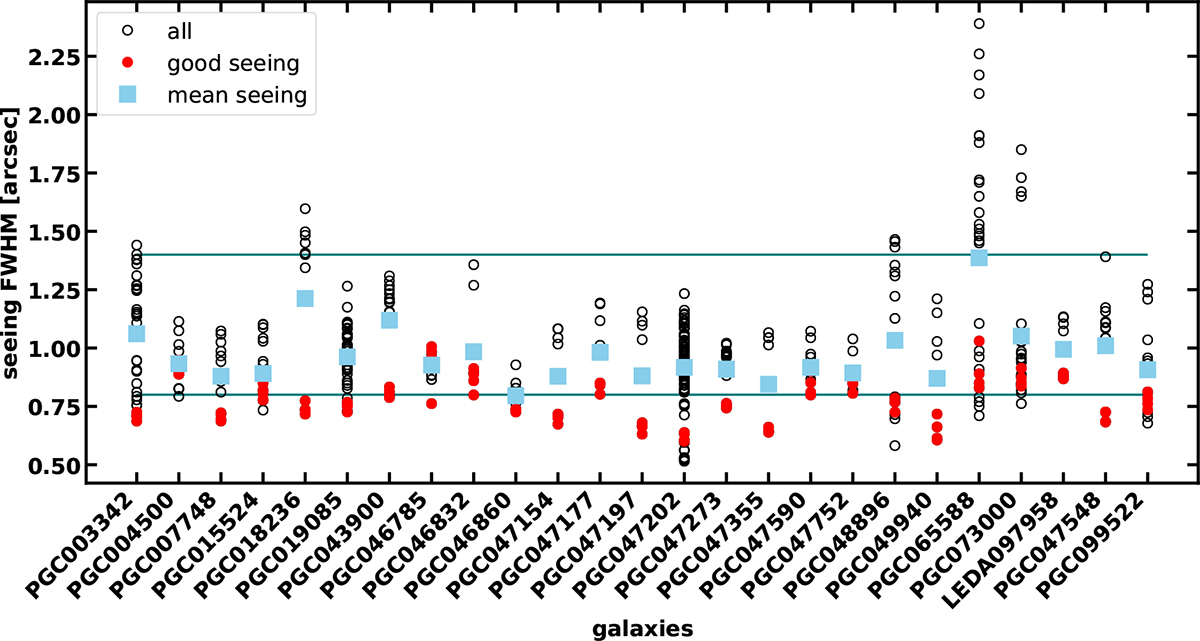
Fig. 2.
Download original image
Distribution of the VLT auto-guider seeing measurements averaged over each exposure taken with MUSE for all M3G galaxies. Horizontal lines denote the two seeing limits imposed on the programme. Blue squares show the mean value of all observations for each galaxy. Red circles are exposures targeted to be done in ‘good seeing’ conditions (FWHM < 0.8″).
Current usage metrics show cumulative count of Article Views (full-text article views including HTML views, PDF and ePub downloads, according to the available data) and Abstracts Views on Vision4Press platform.
Data correspond to usage on the plateform after 2015. The current usage metrics is available 48-96 hours after online publication and is updated daily on week days.
Initial download of the metrics may take a while.