Fig. 3.
Download original image
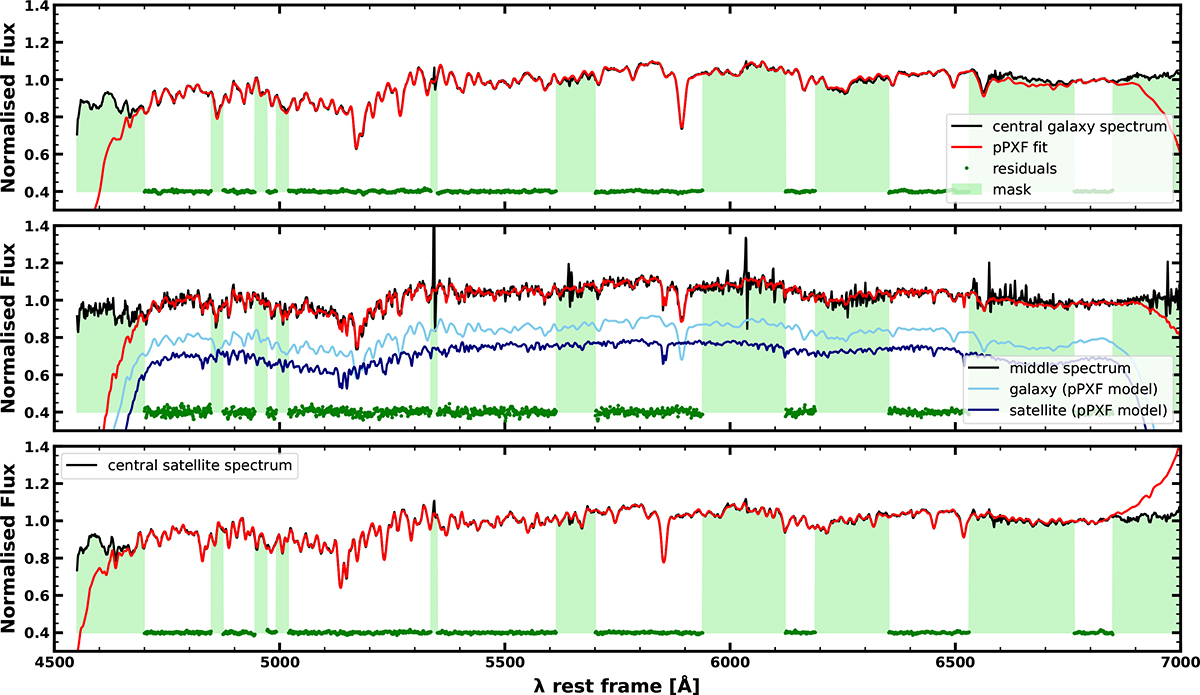
Spectral fits using pPXF for three different spectra from the PGC 099188* MUSE field, which features a large interloping satellite. From top to bottom, the panels show the central spectrum of PGC 099188*, a spectrum from the midpoint between the centre of PGC 099188* and the interloping satellite, and the central spectrum of the interloping satellite. In each panel, the black line shows the observed spectrum, and the red line shows the pPXF fit, with the residual of the fit in green points at the bottom. Green shaded polygons are masked regions excluded from the fit. The middle panel has two additional spectra shown by light and dark blue colours, belonging to the main galaxy and the satellite, respectively. These are model spectra vertically shifted for an arbitrary amount, obtained from the pPXF fits highlighting the satellite and the galaxy contributions to the total spectrum.
Current usage metrics show cumulative count of Article Views (full-text article views including HTML views, PDF and ePub downloads, according to the available data) and Abstracts Views on Vision4Press platform.
Data correspond to usage on the plateform after 2015. The current usage metrics is available 48-96 hours after online publication and is updated daily on week days.
Initial download of the metrics may take a while.