Fig. 4.
Download original image
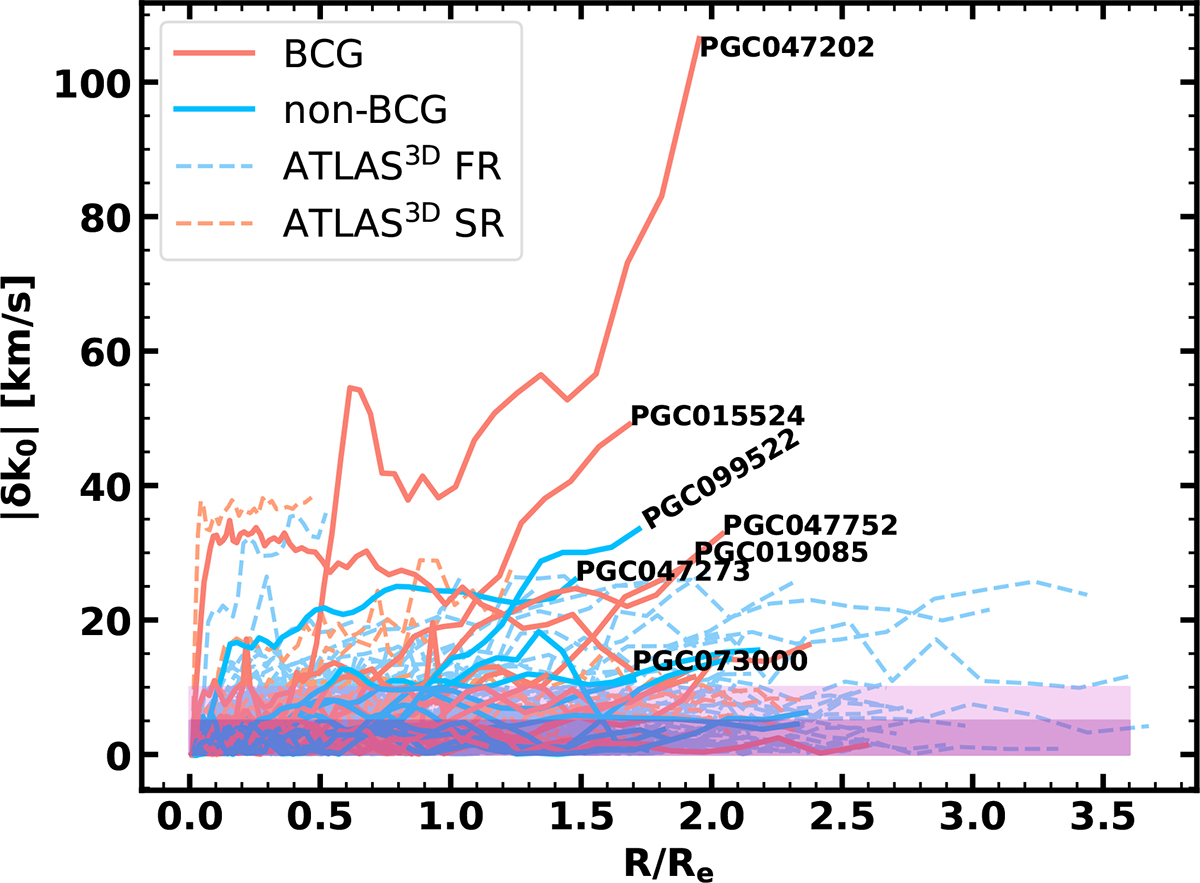
Radial profiles of the absolute k0 variation for M3G galaxies (δk0 = |k0(0)−k0(R)|) compared to the same from the ATLAS3D galaxies. The M3G galaxies are divided into BCGs (red lines) and non-BCGs (blue lines), while ATLAS3D galaxies are divided into fast (light blue dashed lines) and slow (light red dashed lines) rotators. The regions shaded purple show the standard deviation of all ATLAS3D and M3G (darker shaded regions) velocity errors. Names highlight specific galaxies with the largest difference between the maximum and the minimum values of k0: Δk0 > 20 km/s.
Current usage metrics show cumulative count of Article Views (full-text article views including HTML views, PDF and ePub downloads, according to the available data) and Abstracts Views on Vision4Press platform.
Data correspond to usage on the plateform after 2015. The current usage metrics is available 48-96 hours after online publication and is updated daily on week days.
Initial download of the metrics may take a while.