Fig. 7.
Download original image
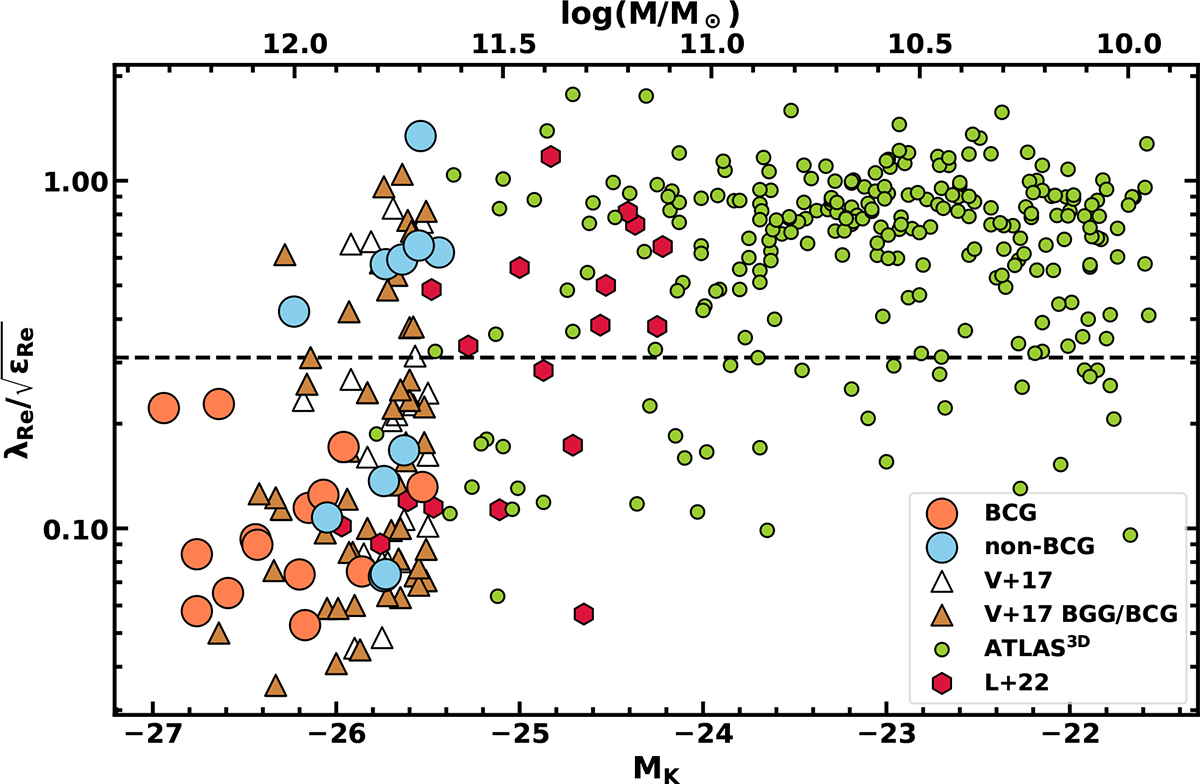
Distribution of the normalised ![]() spin parameter as a function of the Ks band absolute magnitude. The horizontal dashed line (at 0.31) separates slow rotators (below) from fast rotators (above). In the plot are galaxies from the M3G (large circles), MASSIVE (triangles), and ATLAS3D (small green circles) samples. The M3G galaxies are split into BCGs (orange) and non-BCGs (blue), while other galaxies are from the same samples as on Fig. 6. The upper axis is in units of log solar masses, obtained with Eq. (2) from Cappellari (2013).
spin parameter as a function of the Ks band absolute magnitude. The horizontal dashed line (at 0.31) separates slow rotators (below) from fast rotators (above). In the plot are galaxies from the M3G (large circles), MASSIVE (triangles), and ATLAS3D (small green circles) samples. The M3G galaxies are split into BCGs (orange) and non-BCGs (blue), while other galaxies are from the same samples as on Fig. 6. The upper axis is in units of log solar masses, obtained with Eq. (2) from Cappellari (2013).
Current usage metrics show cumulative count of Article Views (full-text article views including HTML views, PDF and ePub downloads, according to the available data) and Abstracts Views on Vision4Press platform.
Data correspond to usage on the plateform after 2015. The current usage metrics is available 48-96 hours after online publication and is updated daily on week days.
Initial download of the metrics may take a while.