Fig. 8.
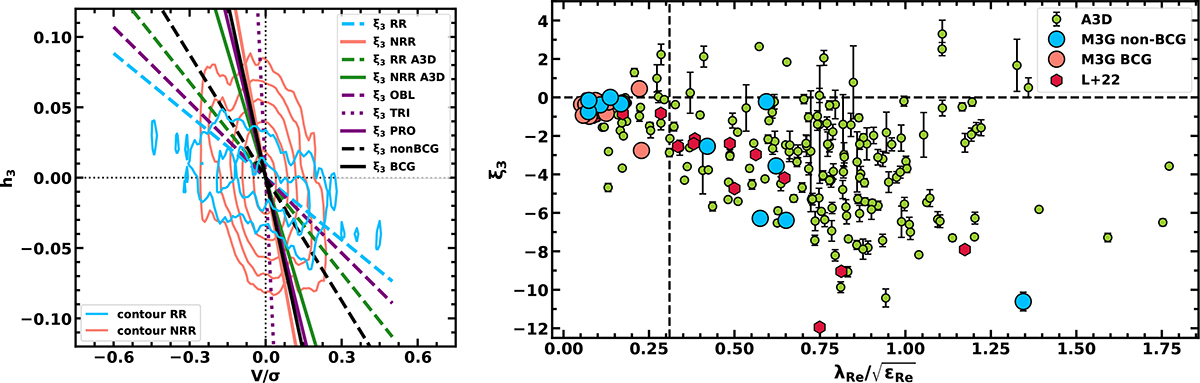
Download original image
Observed anti-correlation between V/σ and h3. Left: Local V/σ − h3 relation for every spectrum within the effective radius and with an error on h3 smaller than 0.05 for M3G galaxies. Red contours are for NRR galaxies, and blue contours are for RR galaxies, and they are based on logarithmic number counts starting from 0.25 with a step of 0.5. Straight lines show the slopes of V/σ − h3 distributions estimated by the ξ3 parameter (see Section 4.3 for details) for M3G galaxies separated into RR (blue) and NRR (red), BCGs (black solid) and non-BCGs (black dashed), and three classes based on the kinematic misalignment angle (see Table S2): ‘oblate’ (violet dashed), ‘triaxial’ (violet dotted) and ‘prolate’ (violet solid). The values for the local ETGs from the ATLAS3D survey, also separated into RR and NRR galaxies, are plotted in green. Right: Distribution of individual ξ3 values as a function of the normalised spin parameter where the value of 0.31 separates slow rotators from fast rotators (vertical dashed line). The M3G galaxies are divided into BCGs (red) and non-BCGs (blue) and shown with large red and blue symbols, respectively, while the small light green symbols are for local ETGs from the ATLAS3D survey. Dark red hexagons are from Loubser et al. (2022). The error bars on M3G values are typically smaller than the symbols size.
Current usage metrics show cumulative count of Article Views (full-text article views including HTML views, PDF and ePub downloads, according to the available data) and Abstracts Views on Vision4Press platform.
Data correspond to usage on the plateform after 2015. The current usage metrics is available 48-96 hours after online publication and is updated daily on week days.
Initial download of the metrics may take a while.