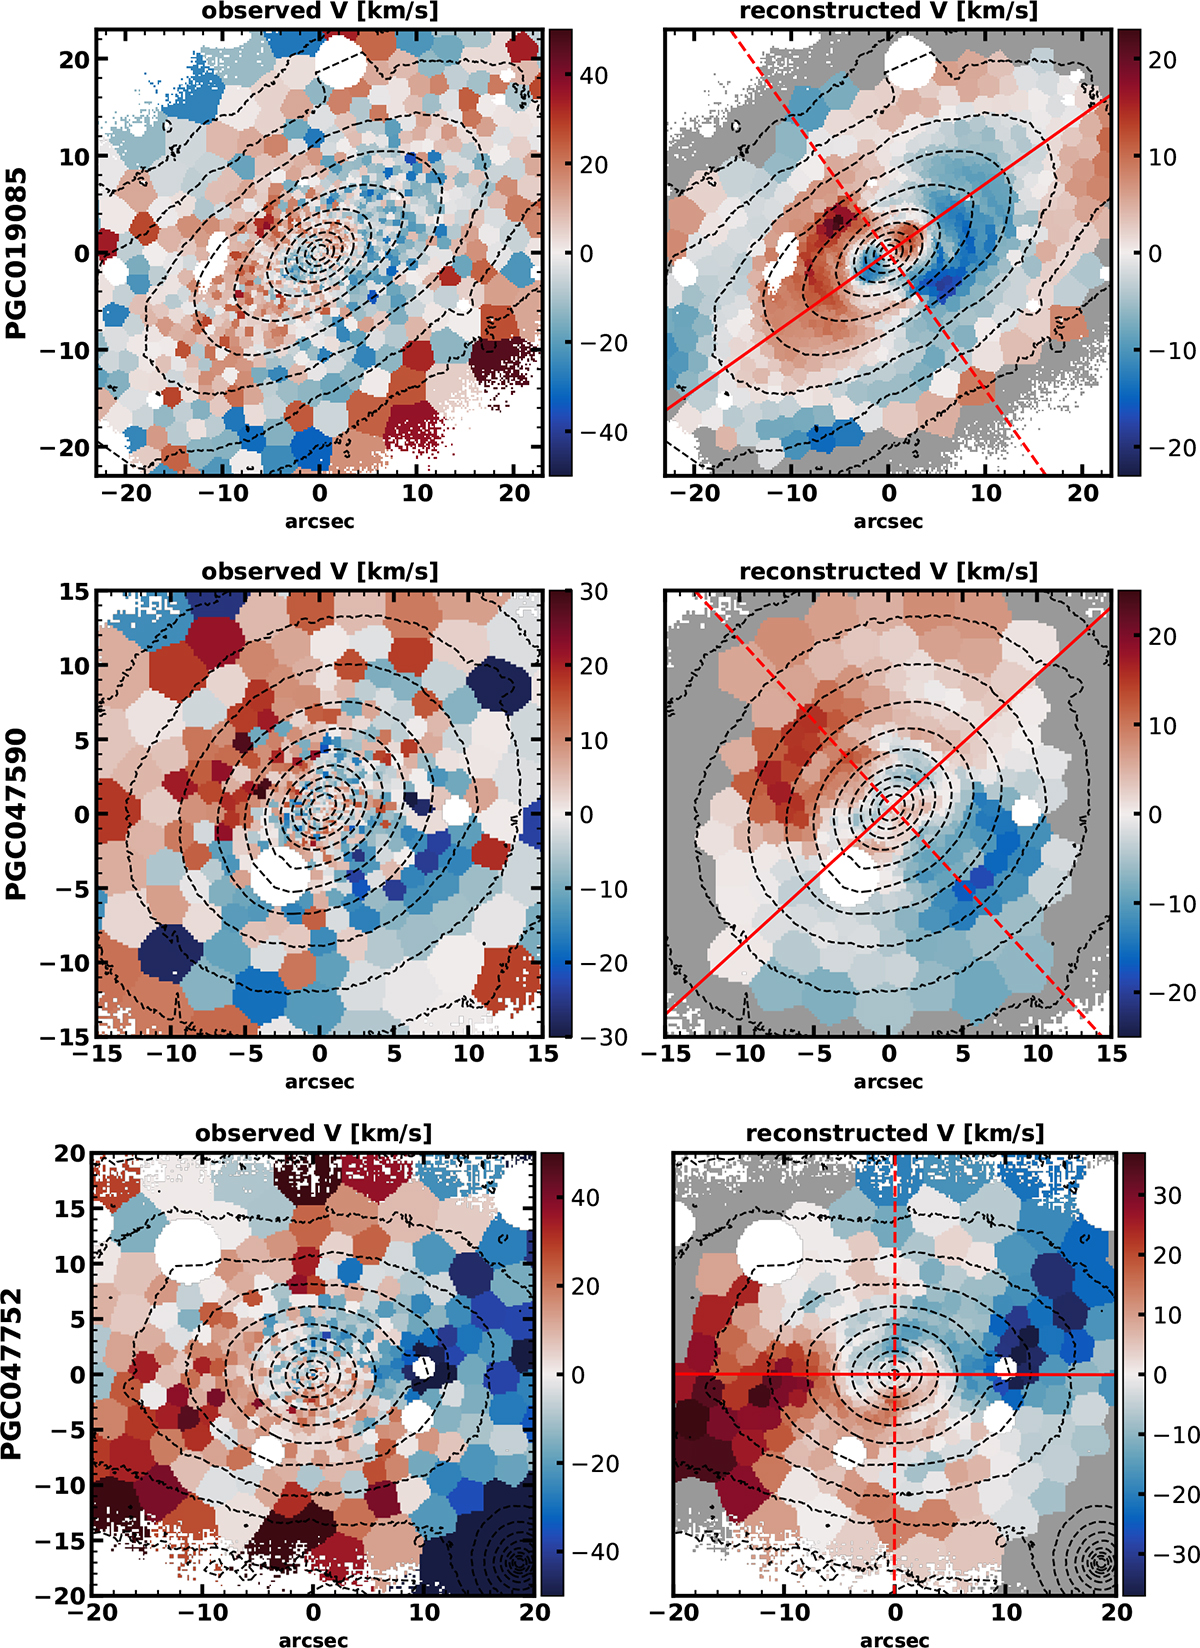
Fig. 9.
Download original image
Galaxies from M3G with extreme velocity maps. The observed map is on the left, and the right panel shows the reconstructed velocity maps using low-order KINEMETRY coefficients, highlighting only the rotational component. We note that the colour bars have somewhat different scales and have been tuned to highlight the features on individual maps. Solid and dashed red lines are the projected major and minor axes of the galaxy, respectively. Kinematic features are best seen by following the spin reversals along the major and minor axes. Another extreme, PGC 046832, was already shown in Fig. 5, which has five visible changes of the rotational orientation.
Current usage metrics show cumulative count of Article Views (full-text article views including HTML views, PDF and ePub downloads, according to the available data) and Abstracts Views on Vision4Press platform.
Data correspond to usage on the plateform after 2015. The current usage metrics is available 48-96 hours after online publication and is updated daily on week days.
Initial download of the metrics may take a while.