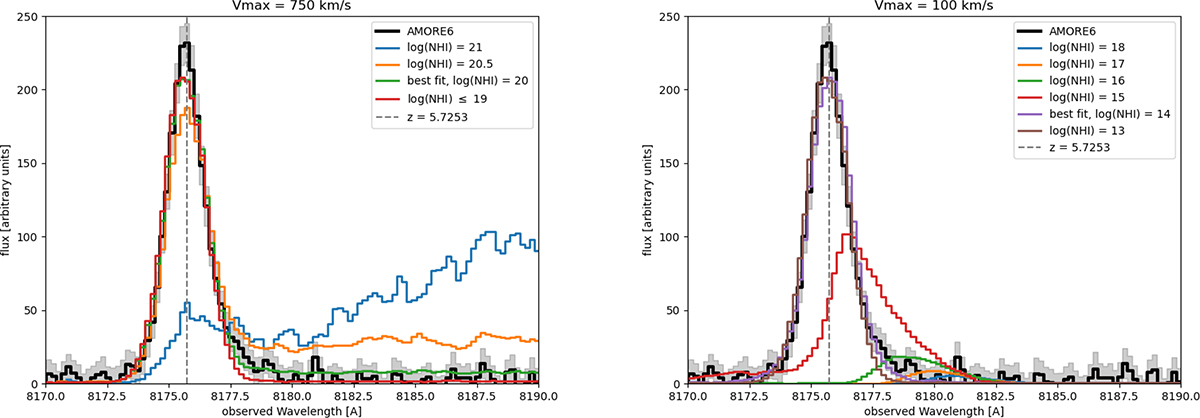
Fig. B.1.
Download original image
Emergent Lyα line profiles from a grid of idealized radiative-transfer models (see text). Left: high-velocity shell (Vmax = 750 km s−1); varying NHI shows that log(NHI) ≲ 20 reproduces the observed profile but requires an extreme outflow. Right: low-velocity case (Vmax = 100 km s−1); matching the data demands very low columns, log(NHI) ≲ 14. Both panels assume the systemic redshift z = 5.7253.
Current usage metrics show cumulative count of Article Views (full-text article views including HTML views, PDF and ePub downloads, according to the available data) and Abstracts Views on Vision4Press platform.
Data correspond to usage on the plateform after 2015. The current usage metrics is available 48-96 hours after online publication and is updated daily on week days.
Initial download of the metrics may take a while.