Fig. 11.
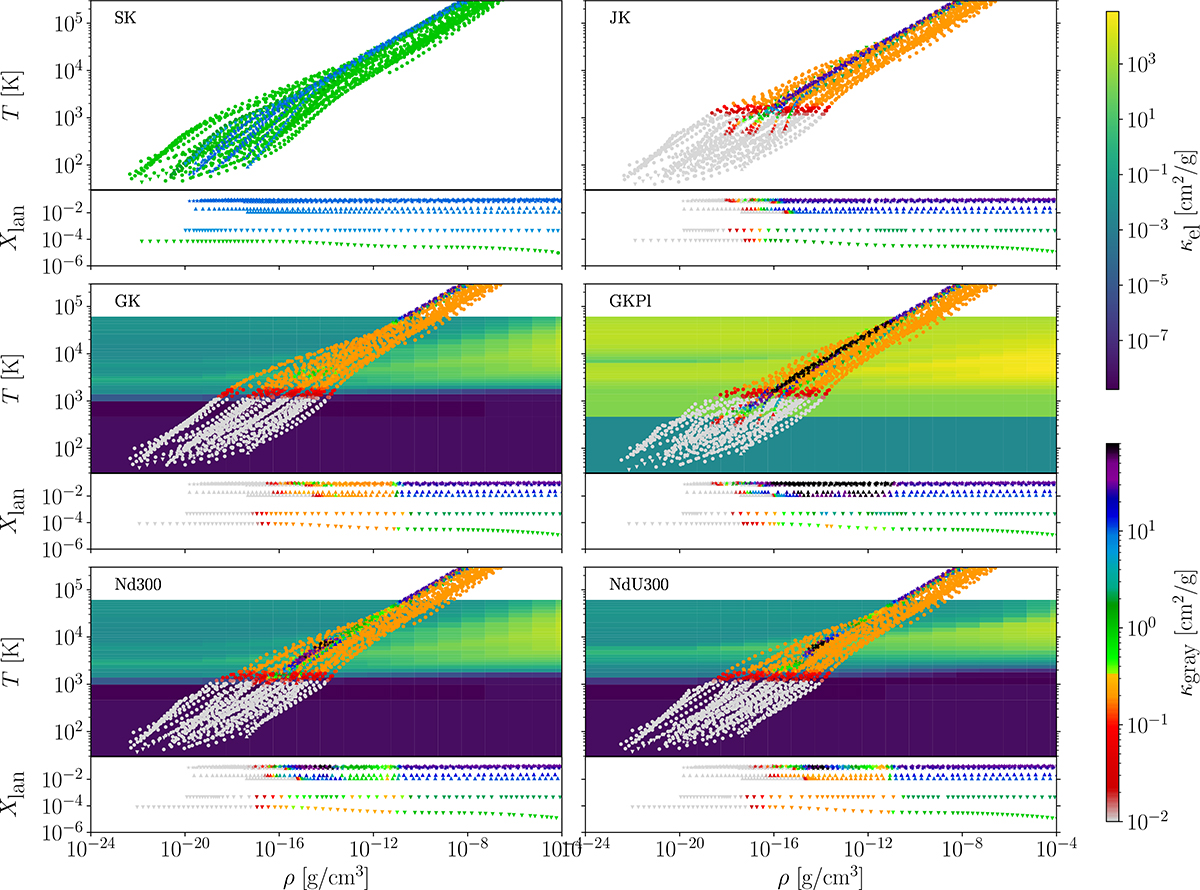
Download original image
Evolution of the gray opacity κgray for a sampling of fluid elements across all angles and depths, from simulations using different opacity models. Top row: Runs using the analytical expression from Wu et al. (2022, left) or the prescription from Just et al. (2022, right). Central row: Simulations with Rosseland (left) or Planck (right) gray opacities computed from the LANL data for neodymium as representative of the lanthanides. Bottom row: Rosseland mean opacity from the multigroup models using only neodymium to represent lanthanides (left) or also uranium as representative of actinides (right). The color bar is cut at κgray = 10−2 cm2g−1 for easier visualization. For each simulation, the top and bottom subpanels show the trajectories of the fluid elements in the density-temperature and density-cumulative lanthanides mass fraction (Xlan) planes, respectively. Markers indicate different orders of magnitudes of Xlan, with circles for Xlan < 5 × 10⁻⁵, downward triangles for 10−5 < Xlan < 10−3, upward triangles for 10−3 < Xlan < 5 × 10⁻², and stars for Xlan > 5 × 10⁻². For the simulations using only neodymium data, the background shows the single-element mean opacity κel calculated from the LANL tables (Rosseland for GK and Nd300, Planck for GKPl). Similarly, the uranium Rosseland mean opacity is shown in the NdU300 panel.
Current usage metrics show cumulative count of Article Views (full-text article views including HTML views, PDF and ePub downloads, according to the available data) and Abstracts Views on Vision4Press platform.
Data correspond to usage on the plateform after 2015. The current usage metrics is available 48-96 hours after online publication and is updated daily on week days.
Initial download of the metrics may take a while.