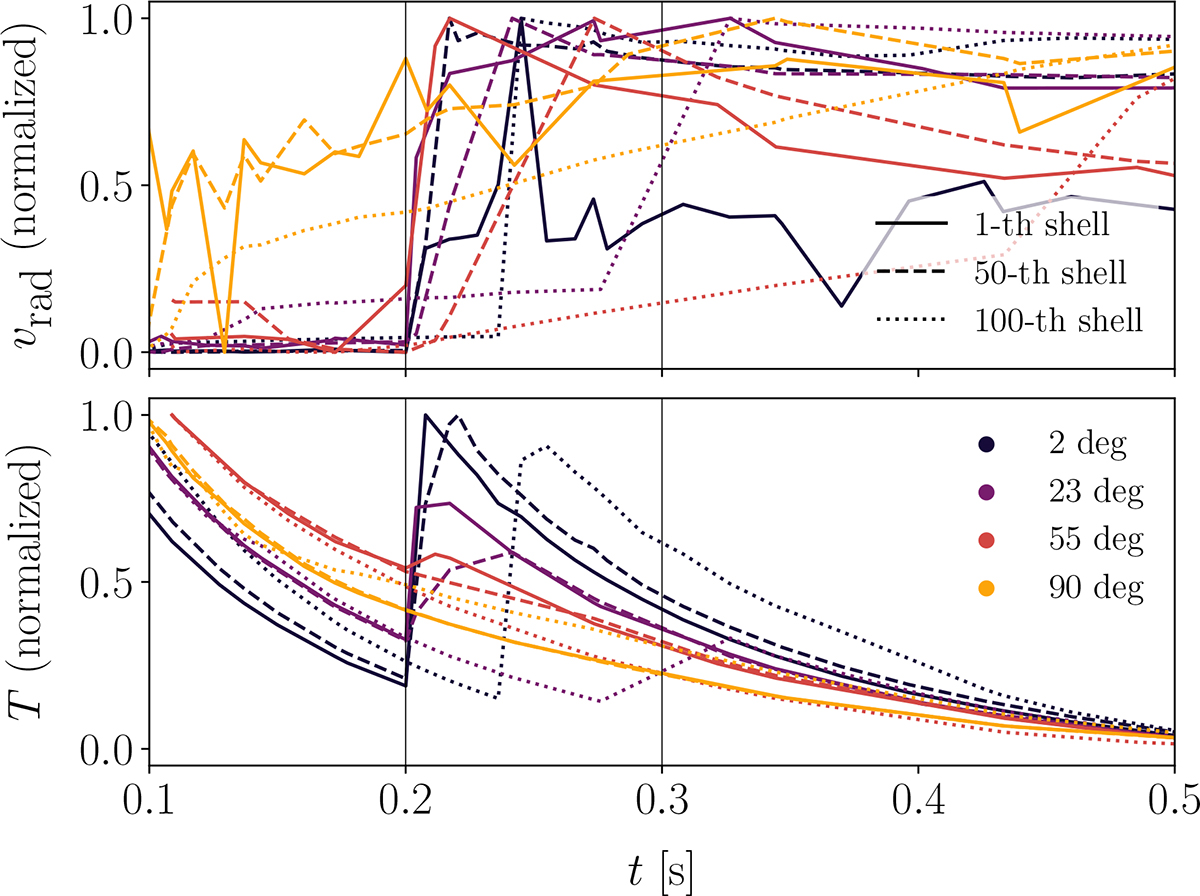
Fig. 14.
Download original image
Radial velocity (top) and temperature (bottom) for a set of fluid elements from the GK simulation including the polar jet. Both quantities are rescaled to the interval [0, 1] for visualization purposes. Colors and styles correspond to different angular sections or mass-shell indices, respectively. The vertical black lines indicate the duration of the jet.
Current usage metrics show cumulative count of Article Views (full-text article views including HTML views, PDF and ePub downloads, according to the available data) and Abstracts Views on Vision4Press platform.
Data correspond to usage on the plateform after 2015. The current usage metrics is available 48-96 hours after online publication and is updated daily on week days.
Initial download of the metrics may take a while.