Fig. 16.
Download original image
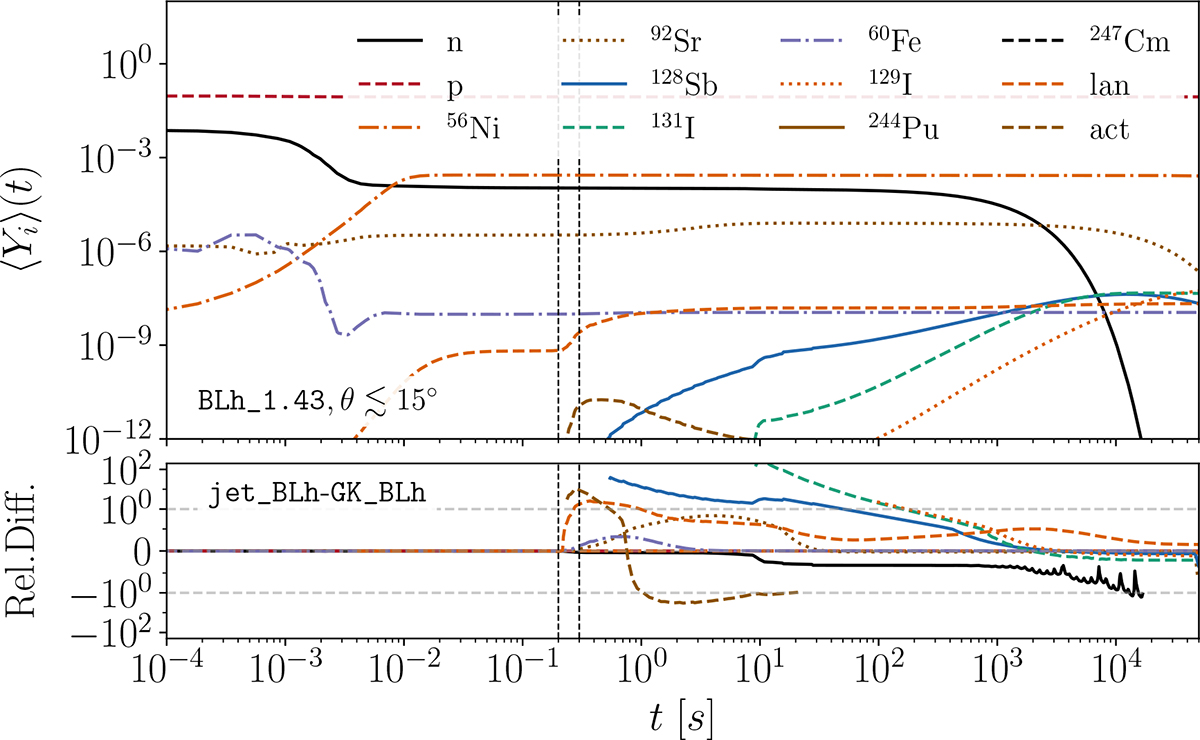
Time evolution of the mass-weighted abundances for selected isotopes and cumulative lanthanides’ and actinides’ abundances in the GK simulation, considering only matter ejected at latitudes’ θ ≲ 15 degrees. The vertical black lines mark the time interval during which the thermal bomb is active. Top panel: Absolute abundances from the simulation including a polar jet (jet). Bottom panel: Relative differences with respect to the same simulation, but without polar jet. The horizontal dashed lines indicate factors-of-unity deviations and the case ⟨Yi⟩=⟨Yipp⟩. Differences are shown only at times when ⟨Yi⟩> 10−12.
Current usage metrics show cumulative count of Article Views (full-text article views including HTML views, PDF and ePub downloads, according to the available data) and Abstracts Views on Vision4Press platform.
Data correspond to usage on the plateform after 2015. The current usage metrics is available 48-96 hours after online publication and is updated daily on week days.
Initial download of the metrics may take a while.