Fig. 17.
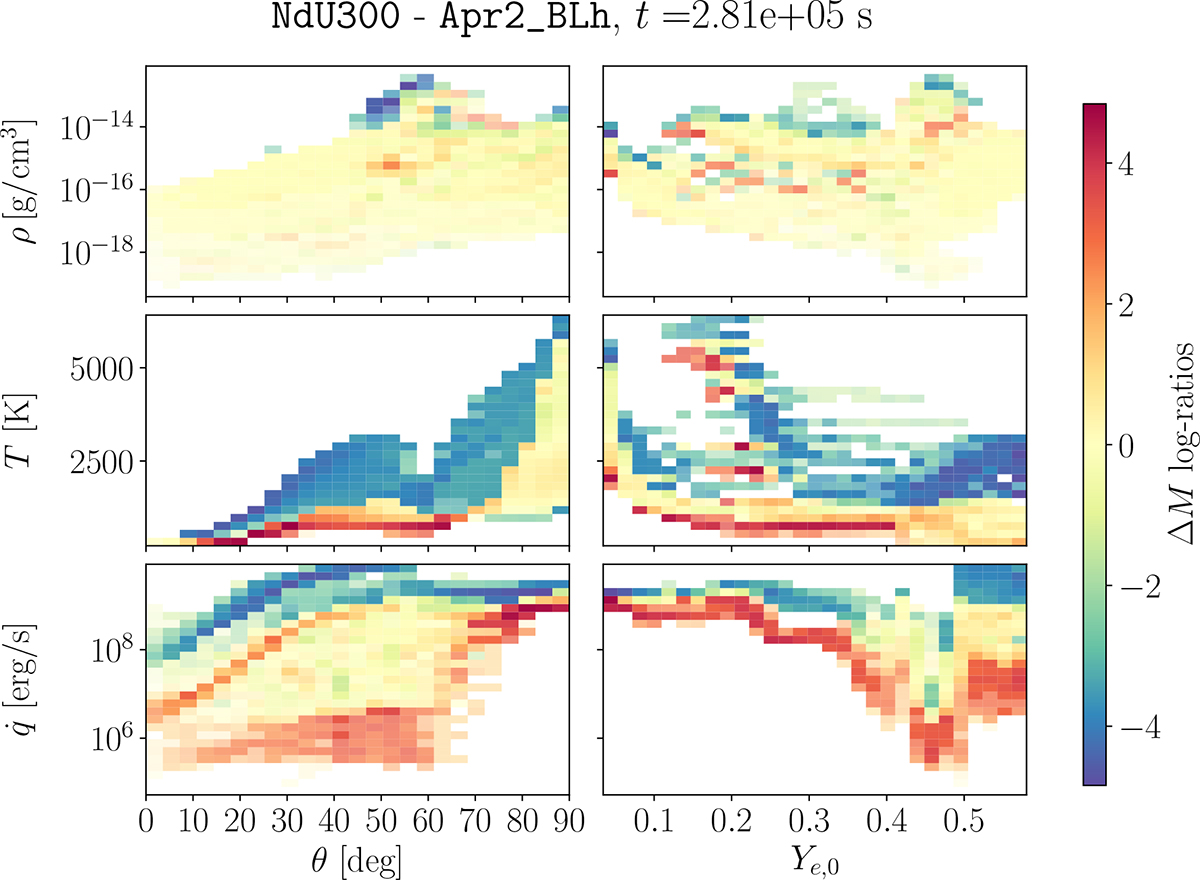
Download original image
Late-time (t ≃ 3 days) ratios between the mass-weighted histograms of the density, temperature, and instantaneous thermalized heating rate obtained from the BLh runs using the in situ NN and our most advanced thermalization and opacity prescriptions (NdU300), or from the 2D ray-by-ray extension of the configuration of Wu et al. (2022) (Apr2_BLh). The left (right) column shows the ratios as functions of the polar angle (initial electron fraction). Bins containing less than 10−5 M⊙ in both simulations are plotted with increasing transparency for decreasing mass content (considering the run with most mass in that bin). Thus, the color encodes the value of the ratio in ΔM, while the saturation reflects the highest between the two original values ΔM (cf. Fig. 5)
Current usage metrics show cumulative count of Article Views (full-text article views including HTML views, PDF and ePub downloads, according to the available data) and Abstracts Views on Vision4Press platform.
Data correspond to usage on the plateform after 2015. The current usage metrics is available 48-96 hours after online publication and is updated daily on week days.
Initial download of the metrics may take a while.