Fig. B.1.
Download original image
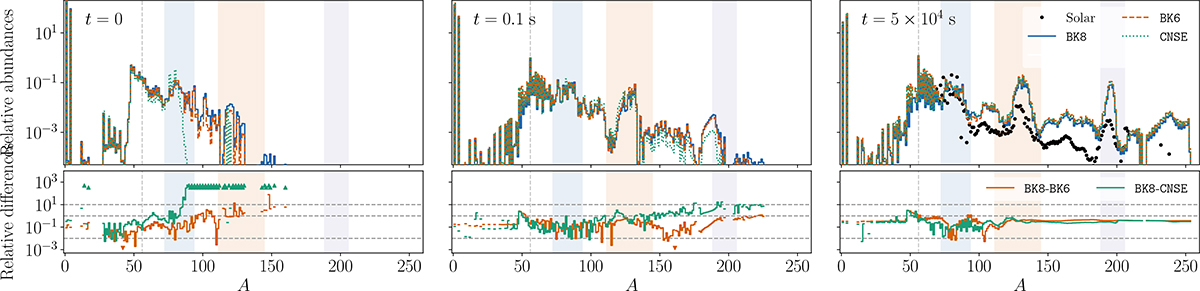
Top panels: Mass-weighted composition of the BLh ejecta profile after initialization (left column), at t = 0.1 s (pre neutron freeze-out, central column), and t = 5 × 10⁴ s (right column). Blue, orange, and green lines show results respectively from the backtrack (TNSE = 8 GK and TNSE = 6 GK) and the cold-NSE initialization procedures. The black dots represent the Solar r-abundances (Prantzos et al. 2020). The abundances are scaled to match a unitary cumulative abundance for the elements of the first r-process peak, with 72 ≤ A ≤ 94. The vertical dashed lines highlight the position of the elements A = 56. The blue, orange, and purple shaded regions remark the position of the first, second and third r-process peaks, respectively. Bottom panel: relative differences against the BK8 run. The upward [downward] triangles indicate discrepancies greater than two orders of magnitude [smaller than 5 × 10⁻⁴]. The horizontal dashed lines mark the factors 0.01, 1, and 10 discrepancies.
Current usage metrics show cumulative count of Article Views (full-text article views including HTML views, PDF and ePub downloads, according to the available data) and Abstracts Views on Vision4Press platform.
Data correspond to usage on the plateform after 2015. The current usage metrics is available 48-96 hours after online publication and is updated daily on week days.
Initial download of the metrics may take a while.