Fig. 3.
Download original image
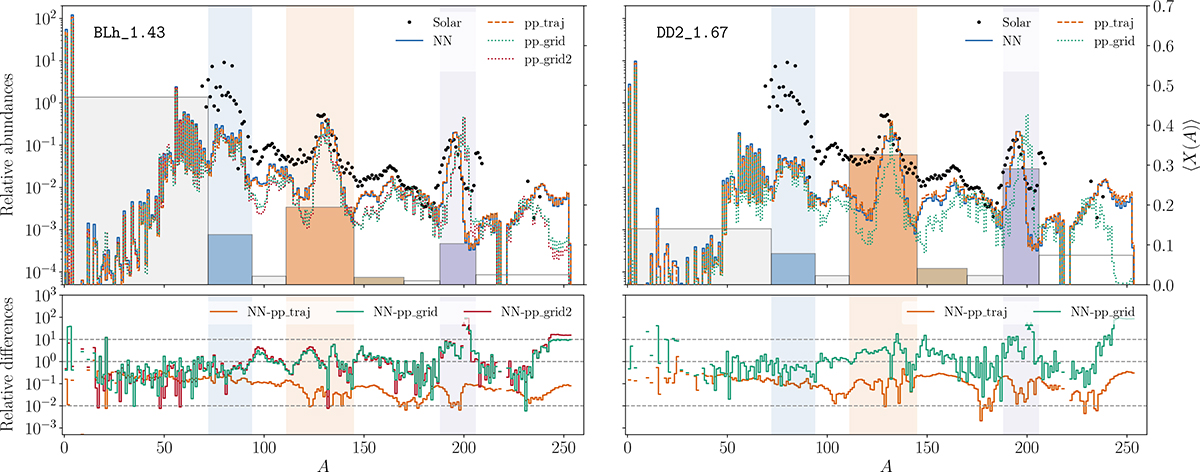
Mass-weighted nucleosynthesis yields at t ≃ 5 × 10⁴ s for the BLh (left column) and DD2 (right column) ejecta profiles. Top panels: Final yields for the simulations performed with in situ NN (blue) or using analytical fits for the nuclear power and post-processing the nucleosynthesis either on the original thermodynamic trajectories (orange), or on analytical density evolutions prescribed from a grid of initial thermodynamic conditions, with a standard (green) or double (red) resolution on the Ye, τ, s grid. The black dots represent the Solar r-process abundances (Prantzos et al. 2020). All the abundances are scaled to produce a unitary total abundance of the elements with 170 ≤ A ≤ 200. The histogram shows, for the in situ NN run, the global cumulative mass fractions of the first (blue), second (orange) and third (purple) r-process peaks, and the rare-earths (brown). Bottom panel: relative differences against the simulation with in situ NN. The upward [downward] triangles indicate discrepancies greater than two orders of magnitude [smaller than 5 × 10⁻⁴]. The horizontal dashed lines highlight the 1% and factors of 1 and 10 discrepancies.
Current usage metrics show cumulative count of Article Views (full-text article views including HTML views, PDF and ePub downloads, according to the available data) and Abstracts Views on Vision4Press platform.
Data correspond to usage on the plateform after 2015. The current usage metrics is available 48-96 hours after online publication and is updated daily on week days.
Initial download of the metrics may take a while.