Fig. 5.
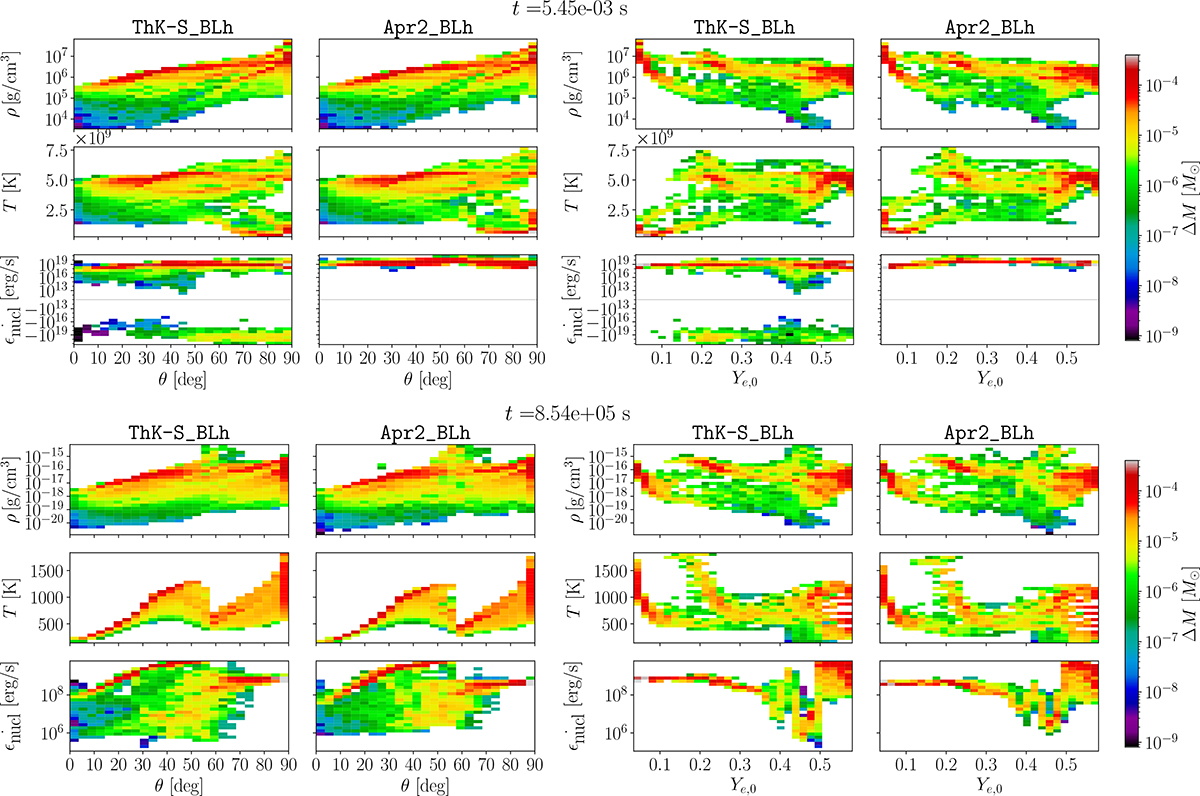
Download original image
Mass-weighted histograms of the density, temperature, and instantaneous thermalized heating rate obtained from the BLh runs using the in situ NN (ThK-S_BLh) or the analytical fits for the nuclear power (Apr2_BLh). The top and bottom groups of plots show the ejecta at early (pre neutron freeze-out) and late (t ≃ 10 days) times. The left [right] column shows the profiles as functions of the polar angle [initial electron fraction]. The gray lines in the heating rate panels separate negative and positive values.
Current usage metrics show cumulative count of Article Views (full-text article views including HTML views, PDF and ePub downloads, according to the available data) and Abstracts Views on Vision4Press platform.
Data correspond to usage on the plateform after 2015. The current usage metrics is available 48-96 hours after online publication and is updated daily on week days.
Initial download of the metrics may take a while.