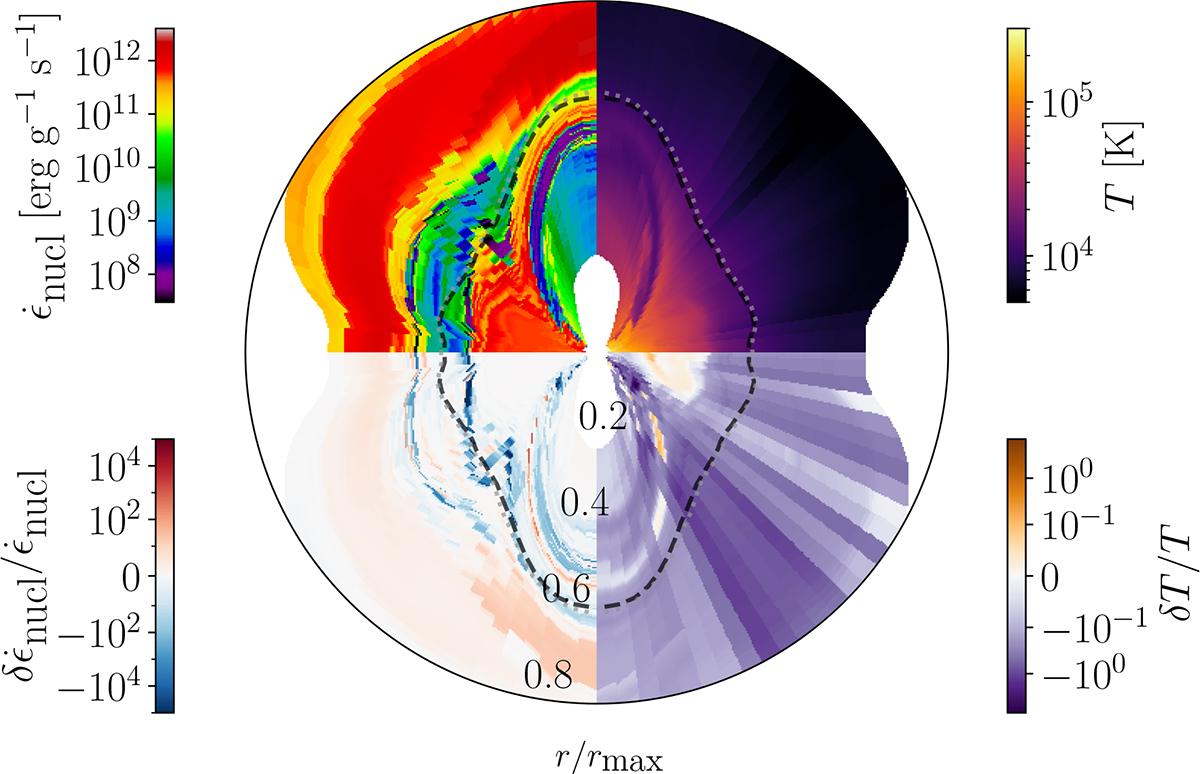
Fig. 7.
Download original image
Thermalized heating rate and temperature profiles of the BLh ejecta at t ∼ 1 hour. The top panels show the results obtained with in situ NN, and the bottom panels show the relative differences with respect to the run using analytical nuclear power fits. The dashed black and the dotted gray lines represent the position of the photosphere in the runs with in situ NN and fits, respectively.
Current usage metrics show cumulative count of Article Views (full-text article views including HTML views, PDF and ePub downloads, according to the available data) and Abstracts Views on Vision4Press platform.
Data correspond to usage on the plateform after 2015. The current usage metrics is available 48-96 hours after online publication and is updated daily on week days.
Initial download of the metrics may take a while.