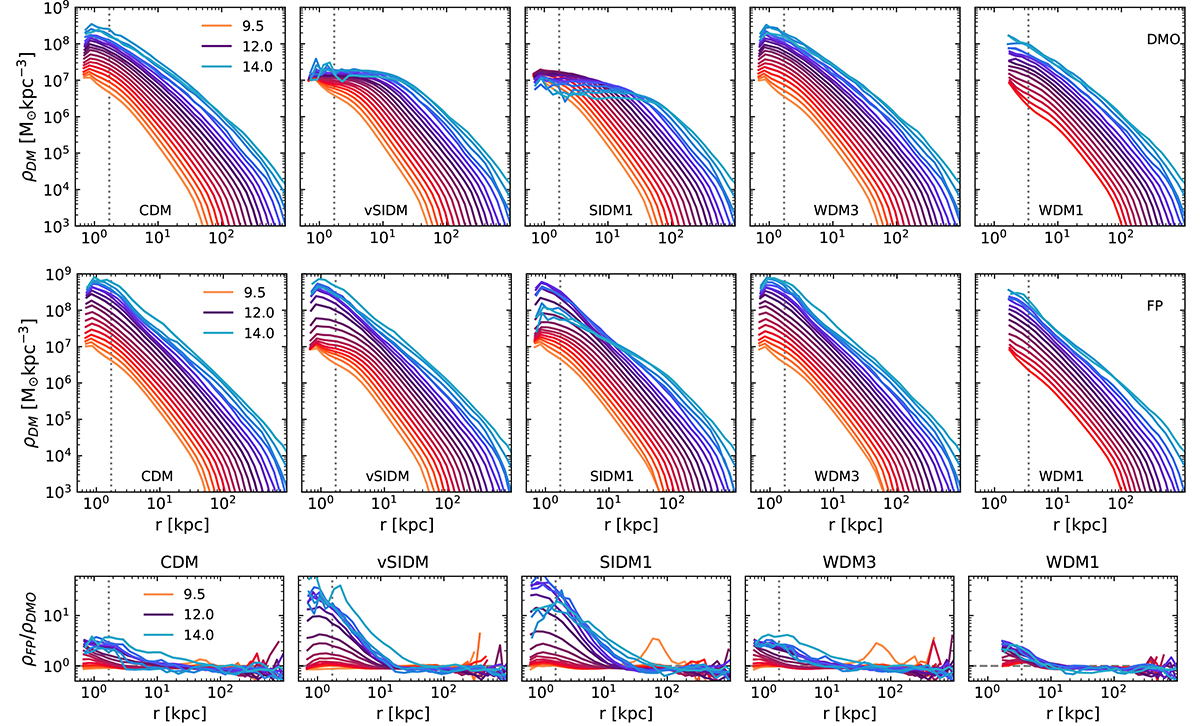
Fig. 1.
Download original image
Mean dark matter profiles for haloes in 21 logarithmically spaced bins in mass between 3 × 10⁹ M⊙ (orange) and 1014 M⊙ (light blue), from the DMO (top) and FP runs (middle). Left to right: CDM, followed by two self-interacting models (vSIDM and SIDM1) and two WDM models (WDM3 and WDM1). We use the 50/A run in the first four panels and the WDM1 50/B box in the rightmost one. The latter only allows us to reliably measure density profiles of M200c ≥ 1010.5 M⊙, with stronger limits on the spatial resolution. In all panels, the dashed vertical line stands for the resolution limit 3ϵDM. When fitting the density profile, we restrict the range further to r ≥ 3ϵDM and haloes with more than 1000 dark matter particles. Bottom: Ratio between the dark matter profiles in the FP and DMO cases, highlighting the contraction caused by baryons.
Current usage metrics show cumulative count of Article Views (full-text article views including HTML views, PDF and ePub downloads, according to the available data) and Abstracts Views on Vision4Press platform.
Data correspond to usage on the plateform after 2015. The current usage metrics is available 48-96 hours after online publication and is updated daily on week days.
Initial download of the metrics may take a while.