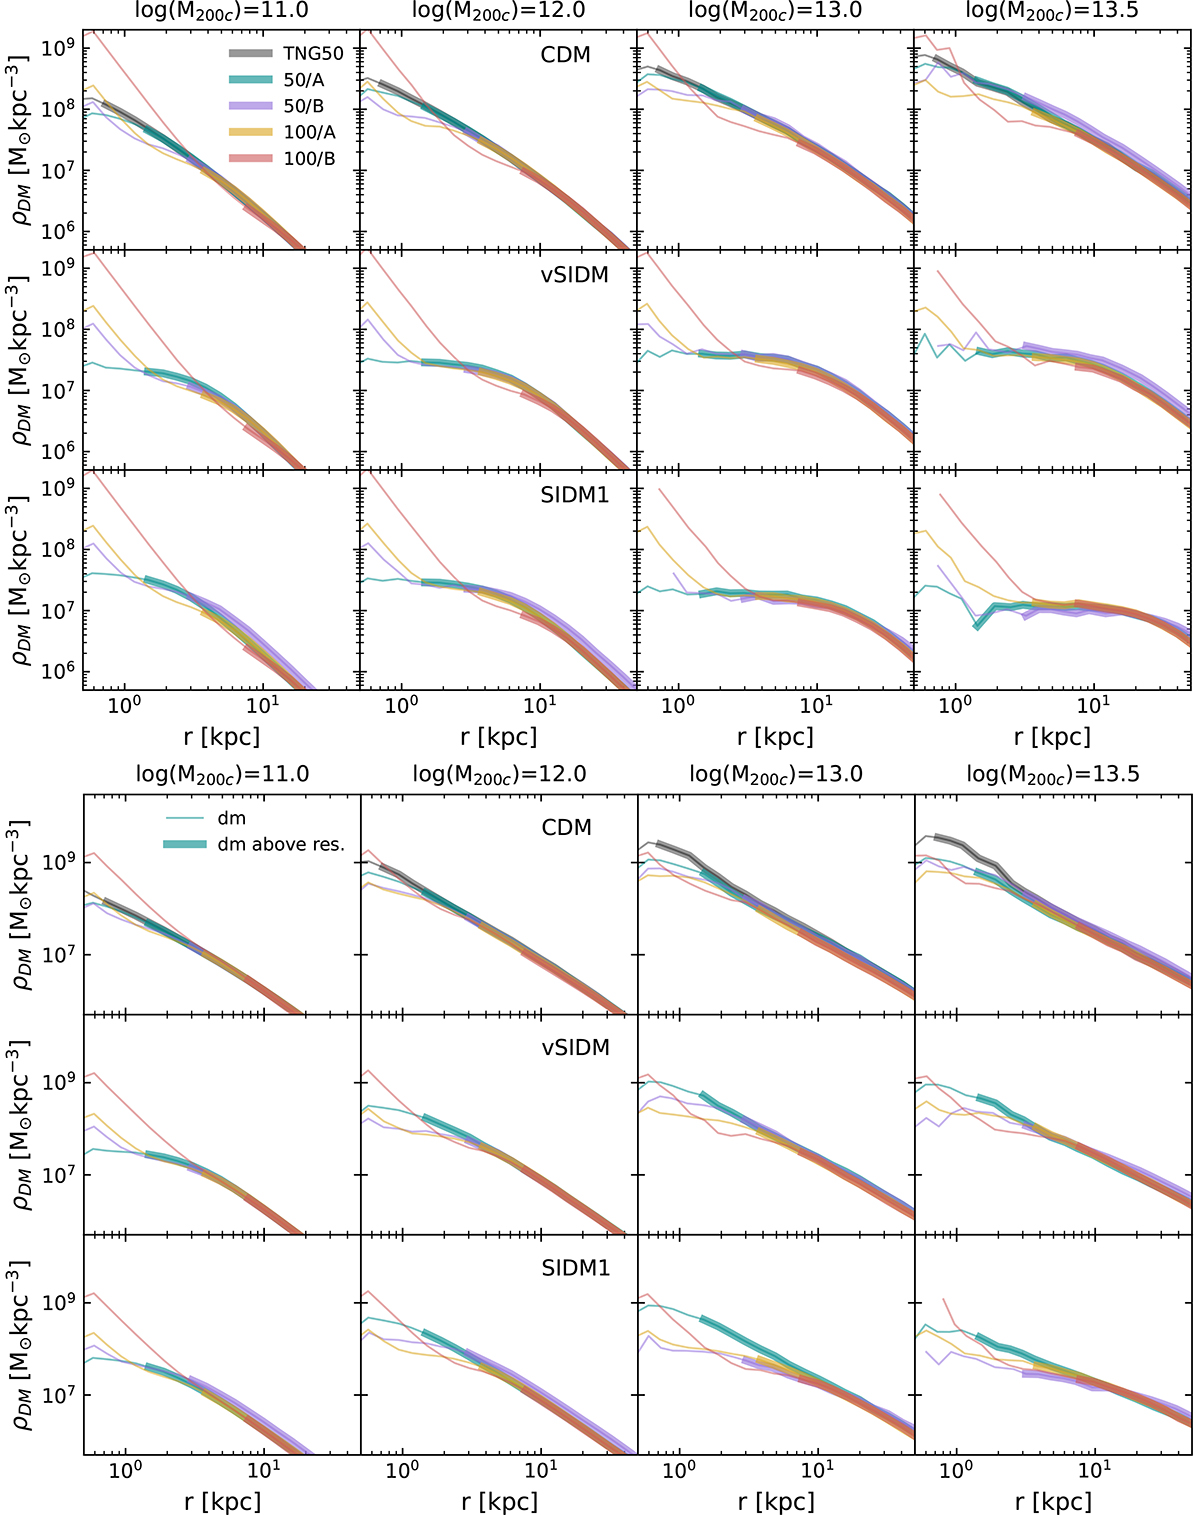
Fig. B.1.
Download original image
Convergence tests for the dark matter profile in the 50/A boxes in the DMO (top) and FP (bottom) runs. We consider CDM, SIDM1, and vSIDM, and we do not show results for the WDM models, as these behave similarly to CDM. For comparison, we also show results from the IllustrisTNG 50 Mpc run, since its resolution is higher than our best case. We plot the mean dark matter profile for four representative bins in halo mass of width 0.2 dex around the reported value. In each panel, the thick solid lines show the density profiles up to the resolution limit of each simulation, while the thinner lines help visualise where convergence breaks at lower radii.
Current usage metrics show cumulative count of Article Views (full-text article views including HTML views, PDF and ePub downloads, according to the available data) and Abstracts Views on Vision4Press platform.
Data correspond to usage on the plateform after 2015. The current usage metrics is available 48-96 hours after online publication and is updated daily on week days.
Initial download of the metrics may take a while.