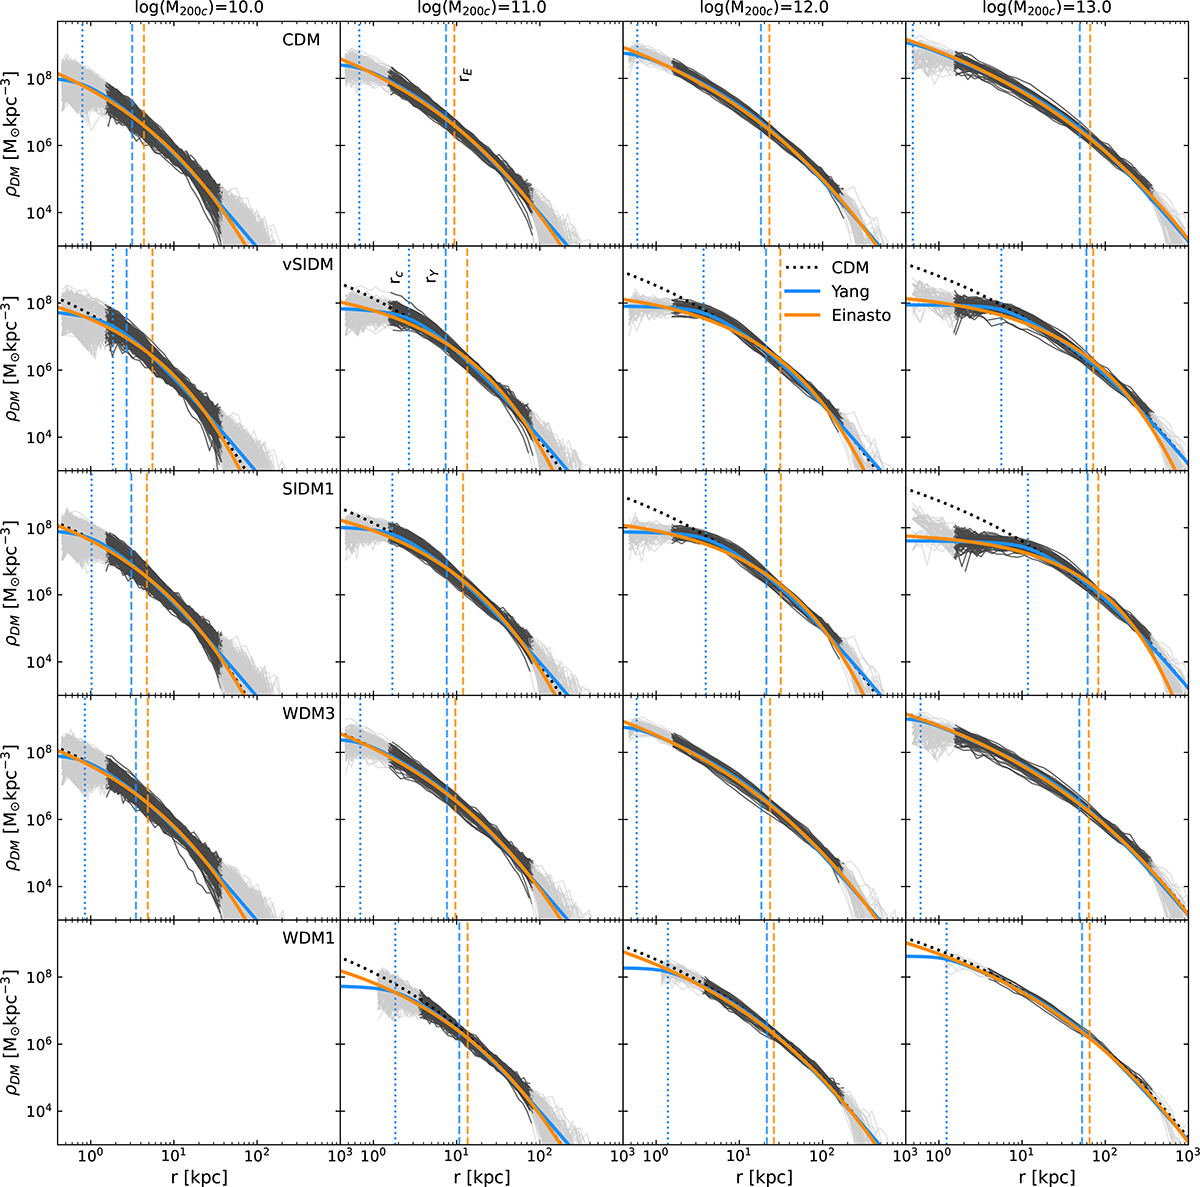
Fig. 3.
Download original image
Examples of halo profiles and best fit in four bins of increasing mass at z = 0 in the DMO runs. We show a different dark matter model in each row. In each panel the grey lines show individual density profiles of haloes in the considered mass bin, while the black line indicates the radial range used to perform the fit (3ϵDM ≤ r ≤ r200c). The Einasto and Y24 best fits to the mean dark matter profile are shown in orange and blue. In the alternative dark matter panels, we also plot the CDM mean as the dotted black line for comparison. The vertical dashed lines of corresponding colour mark the two scale radii rE and rY, while the vertical dotted blue line stands for the Y24 core radius rc. As we only considered systems with more than 1000 particles, we do not show the profiles of WDM1 haloes in the first mass bin.
Current usage metrics show cumulative count of Article Views (full-text article views including HTML views, PDF and ePub downloads, according to the available data) and Abstracts Views on Vision4Press platform.
Data correspond to usage on the plateform after 2015. The current usage metrics is available 48-96 hours after online publication and is updated daily on week days.
Initial download of the metrics may take a while.