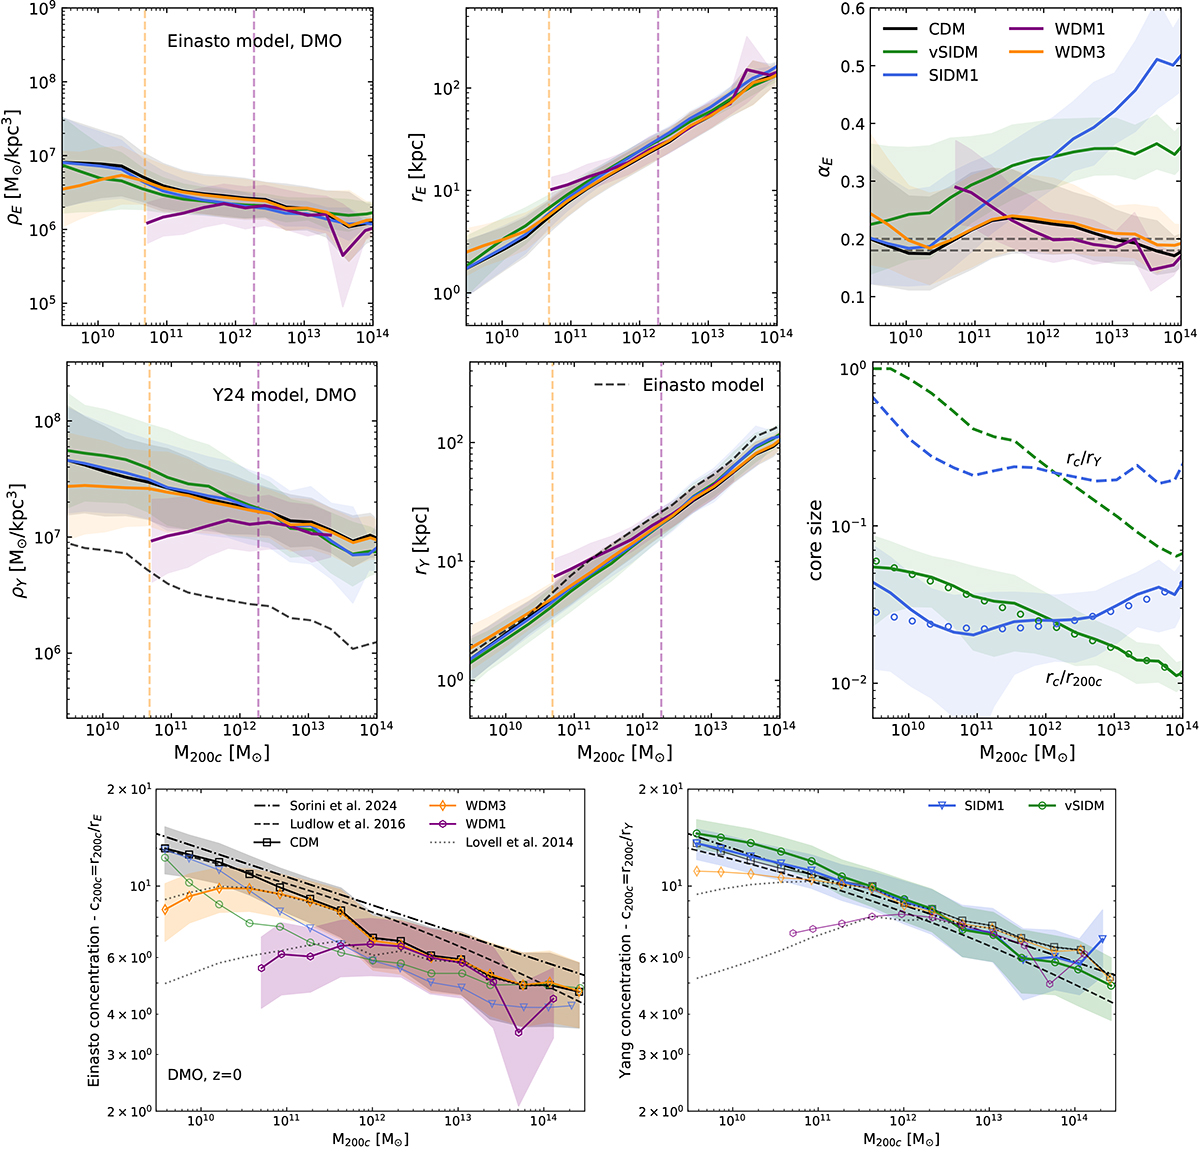
Fig. 4.
Download original image
Distribution of the best-fit profile parameters and concentrations in the DMO runs. Top: Mean best-fit parameters of the Einasto (first row) and Y24 (second row) models, plotted as a function of halo mass at z = 0 in the DMO runs, together with their 1σ uncertainties represented by the coloured bands. In both cases, the first two panels show the mean scale density and radius, while the third panels differ: in the case of Einasto we have the shape parameter αE (compared to the fixed range 0.18–0.2 used in previous works for CDM haloes), while in the Y24 model we show the core radius scaled to the halo radius as rc/r200c (solid lines) and to the scale radius (dashed lines). In the first two panels of the second row, the dashed black lines show the scale density and radius calculated from the Einasto fit in the CDM. In the right panel, the core radius is consistent with zero for the CDM and WDM models, and it is thus only shown for self-interacting scenarios. Here, the open circles correspond to the best-fit models from Eq. (3). Finally, the vertical dashed lines correspond to the value 100Mhm for WDM1 and WDM3, where it is expected that the halo concentration starts deviating from CDM. Bottom: Concentration-mass relation at z = 0 for the DMO runs. On the left (right), we show the results based on the Einasto (Y24) fit. We compare to Ludlow et al. (2016) and to Sorini et al. (2025). The dotted line shows the predicted WDM concentration when applying the correction by Lovell et al. (2014) to the measured CDM relation (black squares). In the previous section, we have demonstrated that CDM and WDM profiles are best fit by Einasto, while SIDM ones by the Y24 profiles. We highlight these with solid lines in the figure and display the remaining ones with lighter colours.
Current usage metrics show cumulative count of Article Views (full-text article views including HTML views, PDF and ePub downloads, according to the available data) and Abstracts Views on Vision4Press platform.
Data correspond to usage on the plateform after 2015. The current usage metrics is available 48-96 hours after online publication and is updated daily on week days.
Initial download of the metrics may take a while.