Fig. 5.
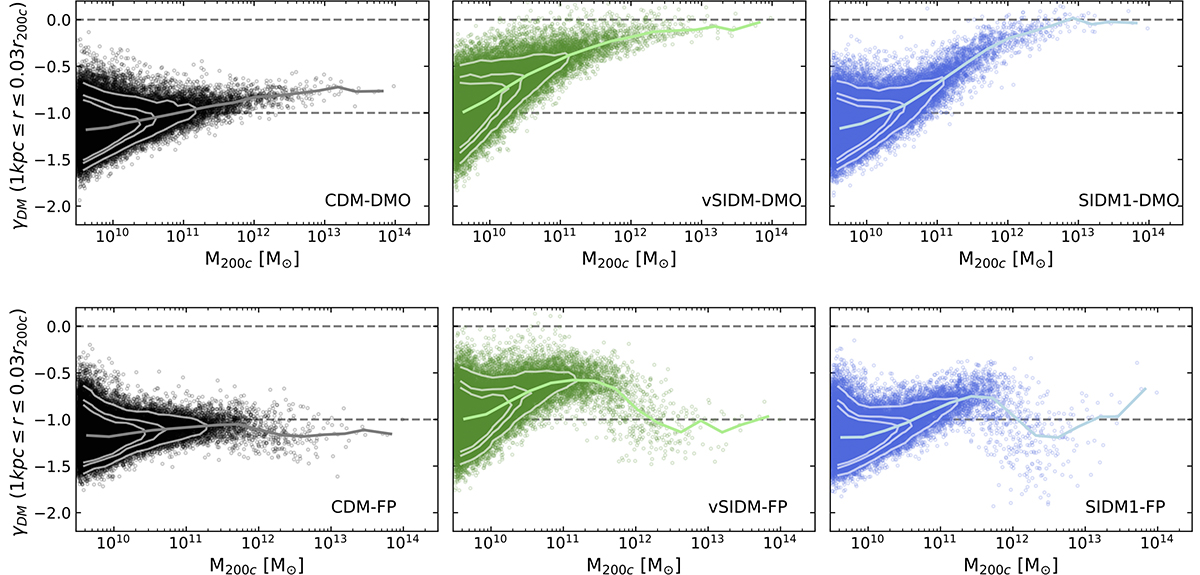
Download original image
Slope of the inner dark matter profile γDM at z = 0, comparing CDM haloes (black) to SIDM1 (blue) and vSIDM (green), in the DMO (top) and FP (bottom) runs. We measure the slope of the profile in the radial range 1 kpc≤r ≤ 0.03r200c, where the latter is chosen based on the Y24 core size distribution from Fig. 4. For low-mass haloes, it may be that this value is too close to the resolution limit, and thus we choose r = 10 kpc as an upper limit. The solid lines show the running medians for each distribution, while the contours represent the 25, 68, and 95 percentiles of the density of points.
Current usage metrics show cumulative count of Article Views (full-text article views including HTML views, PDF and ePub downloads, according to the available data) and Abstracts Views on Vision4Press platform.
Data correspond to usage on the plateform after 2015. The current usage metrics is available 48-96 hours after online publication and is updated daily on week days.
Initial download of the metrics may take a while.