Fig. 6.
Download original image
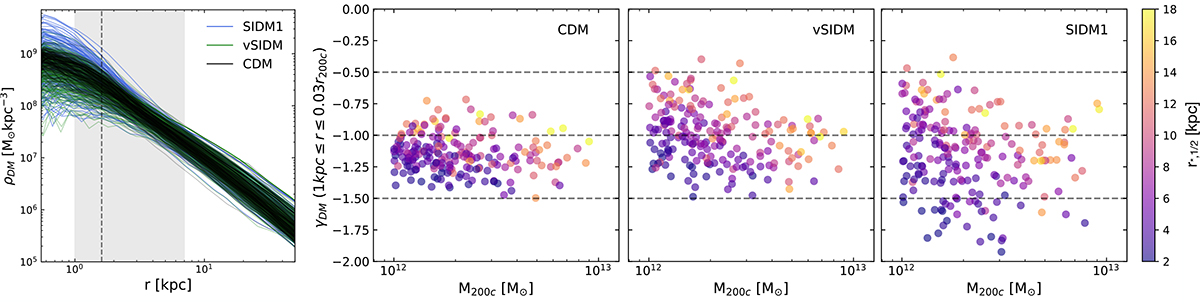
Left: Dark matter density profiles of haloes in the mass range log M200c = [1012 − 1013] M⊙ in the 50/A run, for the CDM (black), vSIDM (green) and SIDM1 (blue) FP runs. We only show the profiles for r ≥ ϵDM. The vertical dashed line marks r = 3ϵDM, while the grey band shows the range used to measure γDM. Right: Inner slope of the dark matter density profiles from the left panel, plotted as a function of halo mass for the three runs and coloured by the stellar half-mass radius r*, 1/2 of the central galaxy.
Current usage metrics show cumulative count of Article Views (full-text article views including HTML views, PDF and ePub downloads, according to the available data) and Abstracts Views on Vision4Press platform.
Data correspond to usage on the plateform after 2015. The current usage metrics is available 48-96 hours after online publication and is updated daily on week days.
Initial download of the metrics may take a while.