Fig. 2
Download original image
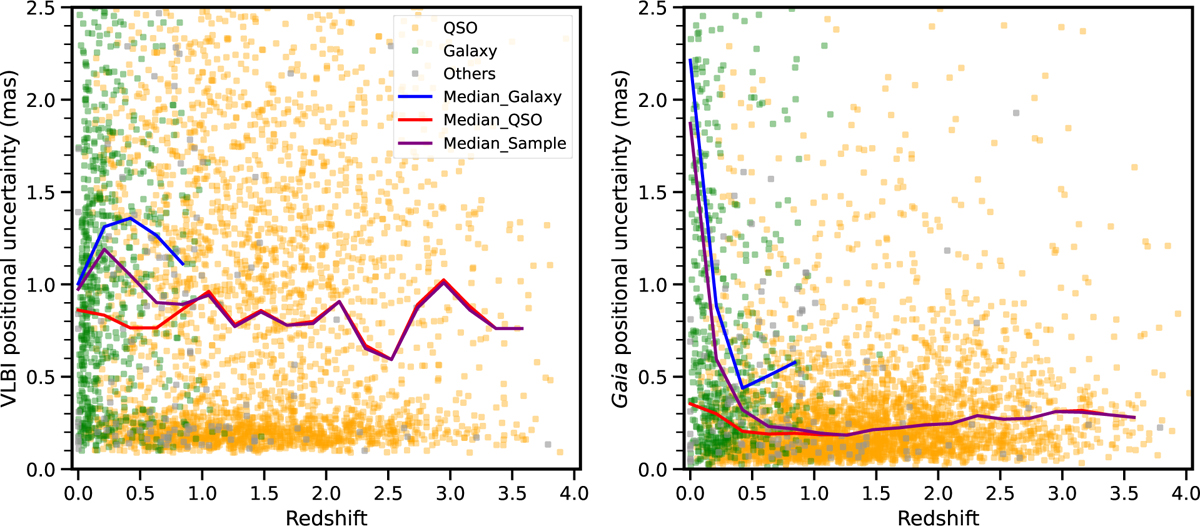
Positional uncertainty derived from RFC VLBI observations (left) and Gaia optical measurements (right) as functions of redshift. For each panel, the orange data points indicate QSOs, the green data points indicate galaxies in the sample, and the grey data points indicate sources that are either unclassified or lack a reliable classification. The blue and red solid lines represent the median values of the galaxies and QSOs, respectively, whereas the purple line represents the median value of the total sample. In addition, to ensure the reliability of the results, median values are not shown for bins containing fewer than 20 data points.
Current usage metrics show cumulative count of Article Views (full-text article views including HTML views, PDF and ePub downloads, according to the available data) and Abstracts Views on Vision4Press platform.
Data correspond to usage on the plateform after 2015. The current usage metrics is available 48-96 hours after online publication and is updated daily on week days.
Initial download of the metrics may take a while.