Fig. B.1
Download original image
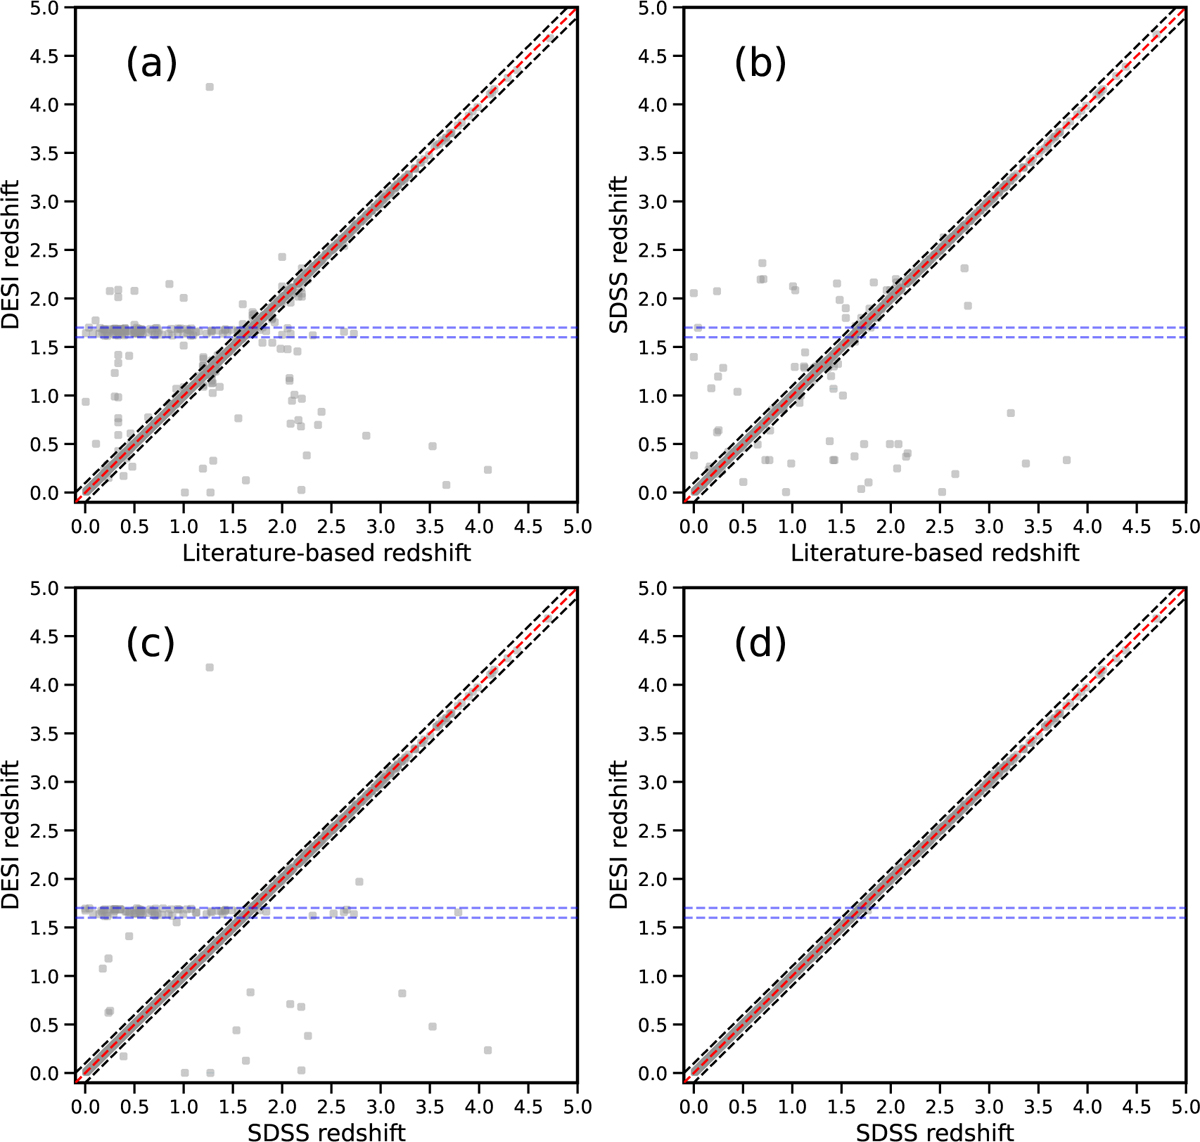
Cross-checking of redshifts derived from different methods. Panel a: Spectroscopic redshifts from DESI versus redshifts from other literature. Panel b: Spectroscopic redshifts from SDSS versus redshifts from other literature. Panel c: Spectroscopic redshifts from DESI versus spectroscopic redshifts from SDSS. Panel d: Spectroscopic redshifts from DESI versus spectroscopic redshifts from SDSS after excluding data points with offsets larger than 0.1, representing the most reliable subset of our final sample. In each panel, grey points represent the original data, the red diagonal dashed line shows the 1:1 relation. The two blue dashed lines mark the region 1.6 < z < 1.7 on the vertical axis, where DESI redshift measurements show known systematic issues. The two black dashed lines mark the region where |∆z| < 0.1; most data points fall within this region, indicating that the redshifts from the two independent measurements are largely consistent.
Current usage metrics show cumulative count of Article Views (full-text article views including HTML views, PDF and ePub downloads, according to the available data) and Abstracts Views on Vision4Press platform.
Data correspond to usage on the plateform after 2015. The current usage metrics is available 48-96 hours after online publication and is updated daily on week days.
Initial download of the metrics may take a while.