Fig. 1
Download original image
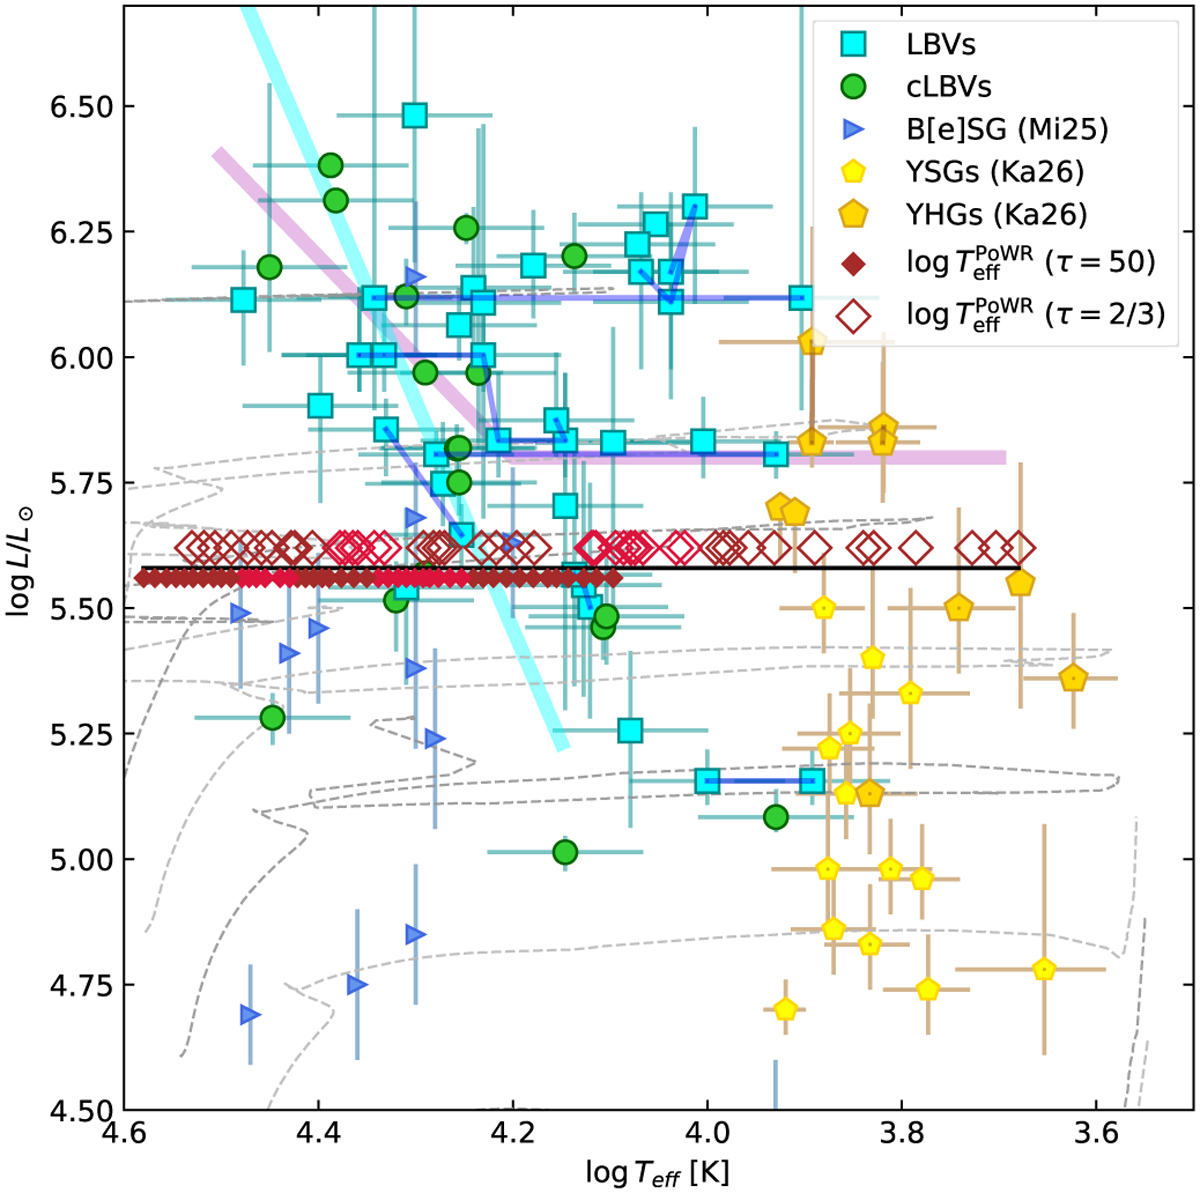
Hertzsprung-Russell diagram depicting our model sequence against LBVs (cyan squares), B[e] SG (blue triangles), OBA hypergiants or LBV candidates (green circles), YSGs (small yellow pentagons), and YHGs (large gold pentagons) from the literature (see Appendix F). The blue lines connecting the LBV data indicate the same star in different epochs. Likewise, the dark orange lines connect YHGs in different epochs. The luminosities are updated to distances mostly based on Gaia DR3 (Bailer-Jones et al. 2021; Gaia Collaboration 2023). The black line indicates the luminosity of our sequence. The small diamonds below indicate T*, and the large open diamonds indicate T2/3. The thin dotted lines indicate the Galactic evolutionary tracks by Ekström et al. (2012). The thick cyan line indicates the LBV instability strip (Groh et al. 2011), and the thick violet line indicates the HD limit (Humphreys & Davidson 1979).
Current usage metrics show cumulative count of Article Views (full-text article views including HTML views, PDF and ePub downloads, according to the available data) and Abstracts Views on Vision4Press platform.
Data correspond to usage on the plateform after 2015. The current usage metrics is available 48-96 hours after online publication and is updated daily on week days.
Initial download of the metrics may take a while.