Fig. 10
Download original image
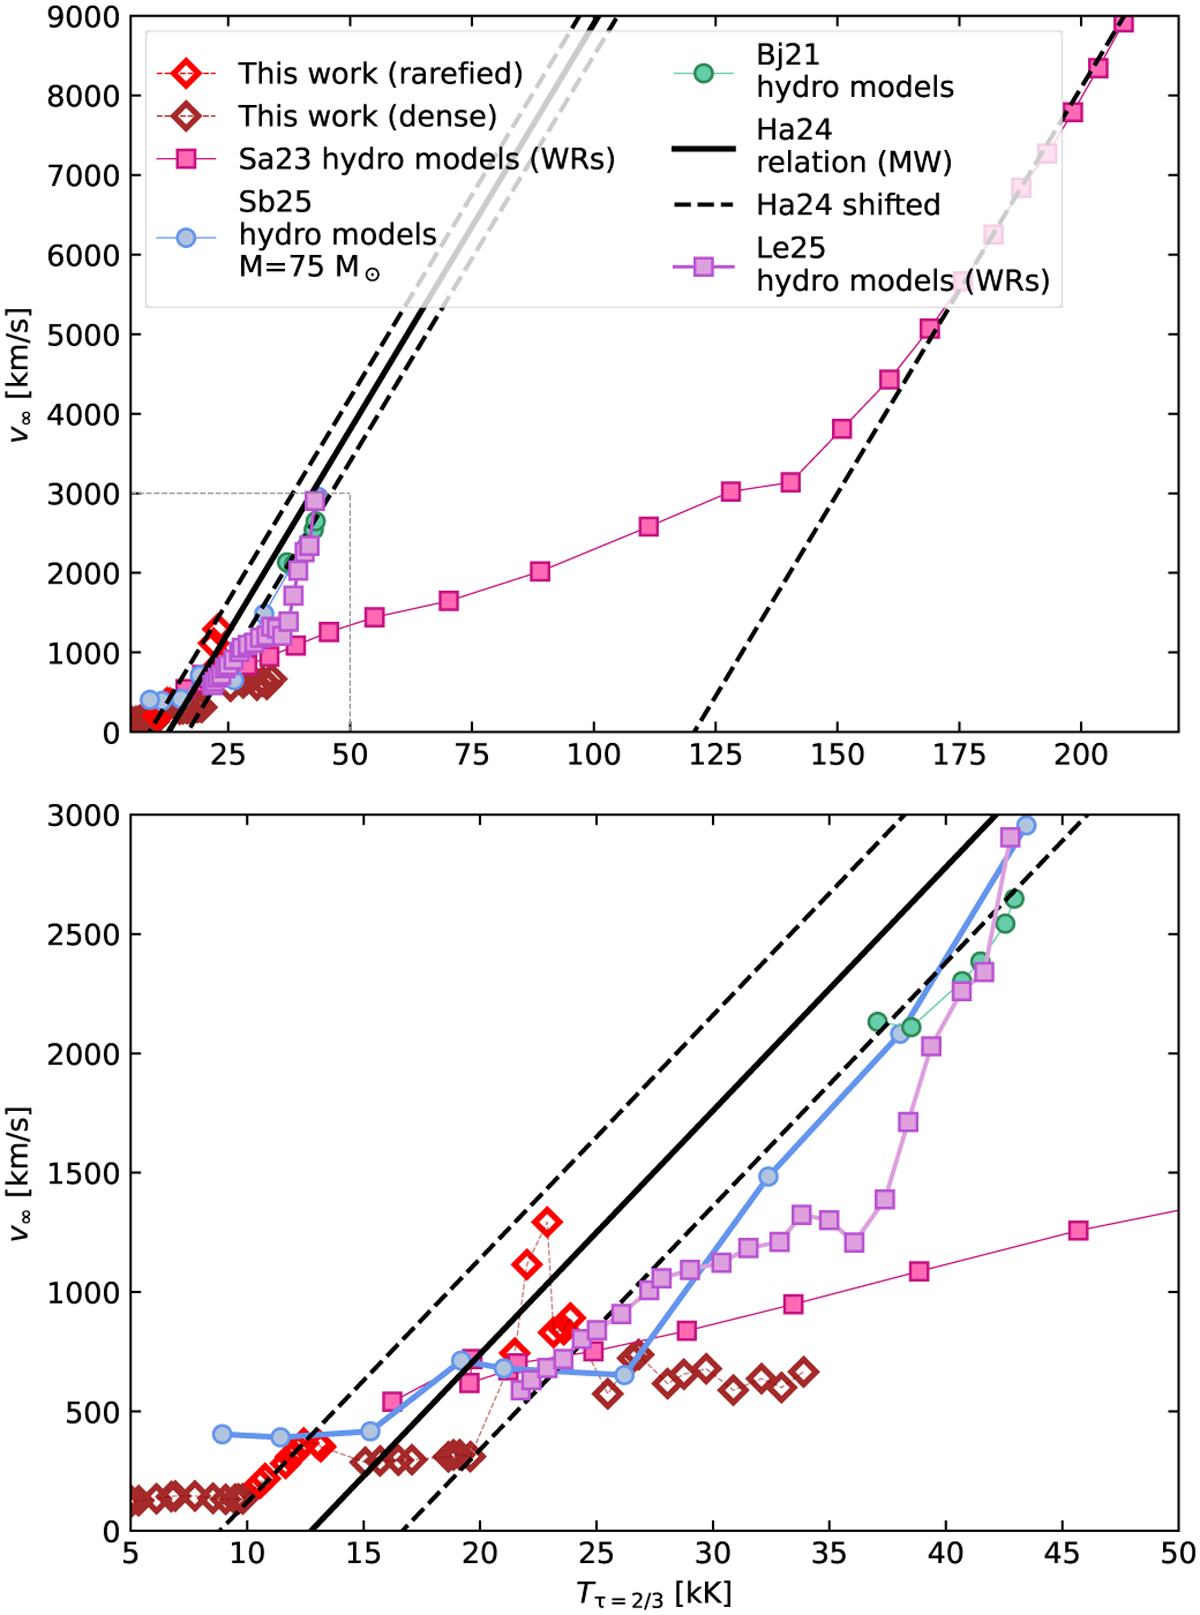
Relation of v∞−Teff for different studies that made hydrodynamically consistent sequences of models in which T* varied. The black lines indicate the empirical relation by Hawcroft et al. (2024) (the solid line represents the actual relation, and the dashed line indicates the relation shifted arbitrarily). The pink and violet squares indicate the models by Sander et al. (2023) and Lefever et al. (2025), respectively. The blue circle indicates the models of Sabhahit et al. (2026) with Γe ∼ 0.35, and the green circle indicates the models of Björklund et al. (2021) with similar Γe. The red and brown diamonds indicate our sequence of models and show the rarefied and dense solutions, respectively. The lower panel is a zoom-in of the region within the dotted rectangle in the upper panel.
Current usage metrics show cumulative count of Article Views (full-text article views including HTML views, PDF and ePub downloads, according to the available data) and Abstracts Views on Vision4Press platform.
Data correspond to usage on the plateform after 2015. The current usage metrics is available 48-96 hours after online publication and is updated daily on week days.
Initial download of the metrics may take a while.