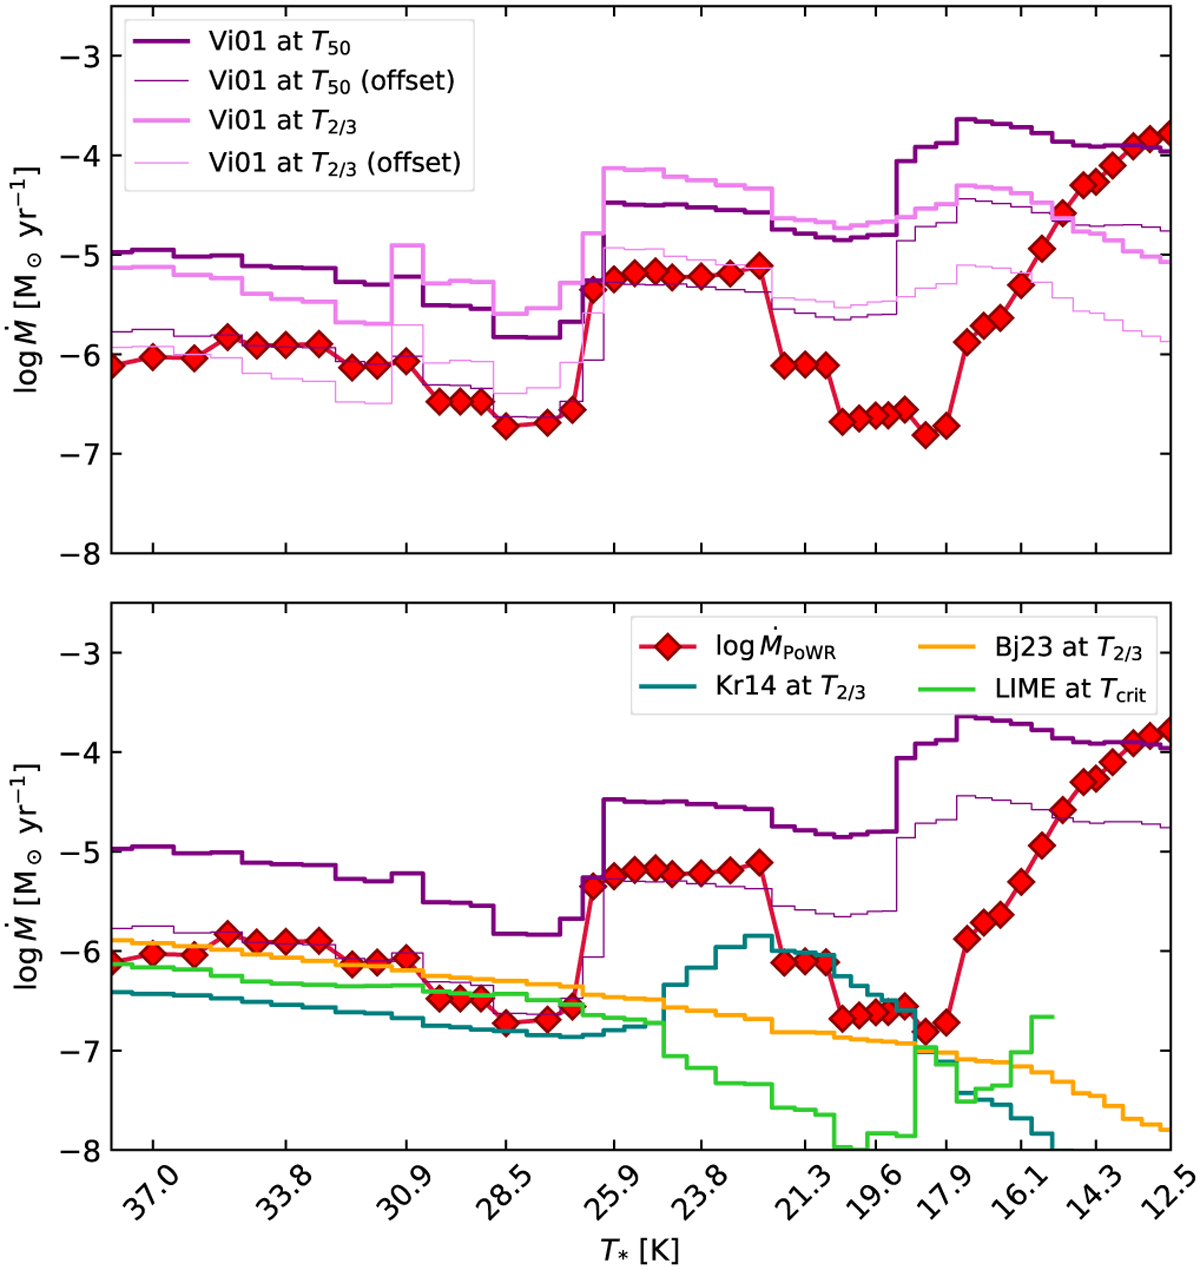
Fig. 11
Download original image
Comparison between the output mass-loss rates of the T* sequence (red curve) and different recipes applied to the stellar properties of each model. The thick purple and fuchsia lines indicate the mass-loss rates by Vink et al. (2001), applied to T* and T2/3, respectively. The thin lines of the same colors indicate the Vink rates with an offset of 0.8 dex. The yellow curve indicates the rates of Björklund et al. (2023), and the teal line indicates the rates of Krtička et al. (2024), both applied to T2/3. The green line indicates the rates computed using the tool LIME (https://lime.ster.kuleuven.be/, Sundqvist et al. 2025).
Current usage metrics show cumulative count of Article Views (full-text article views including HTML views, PDF and ePub downloads, according to the available data) and Abstracts Views on Vision4Press platform.
Data correspond to usage on the plateform after 2015. The current usage metrics is available 48-96 hours after online publication and is updated daily on week days.
Initial download of the metrics may take a while.