Fig. 14
Download original image
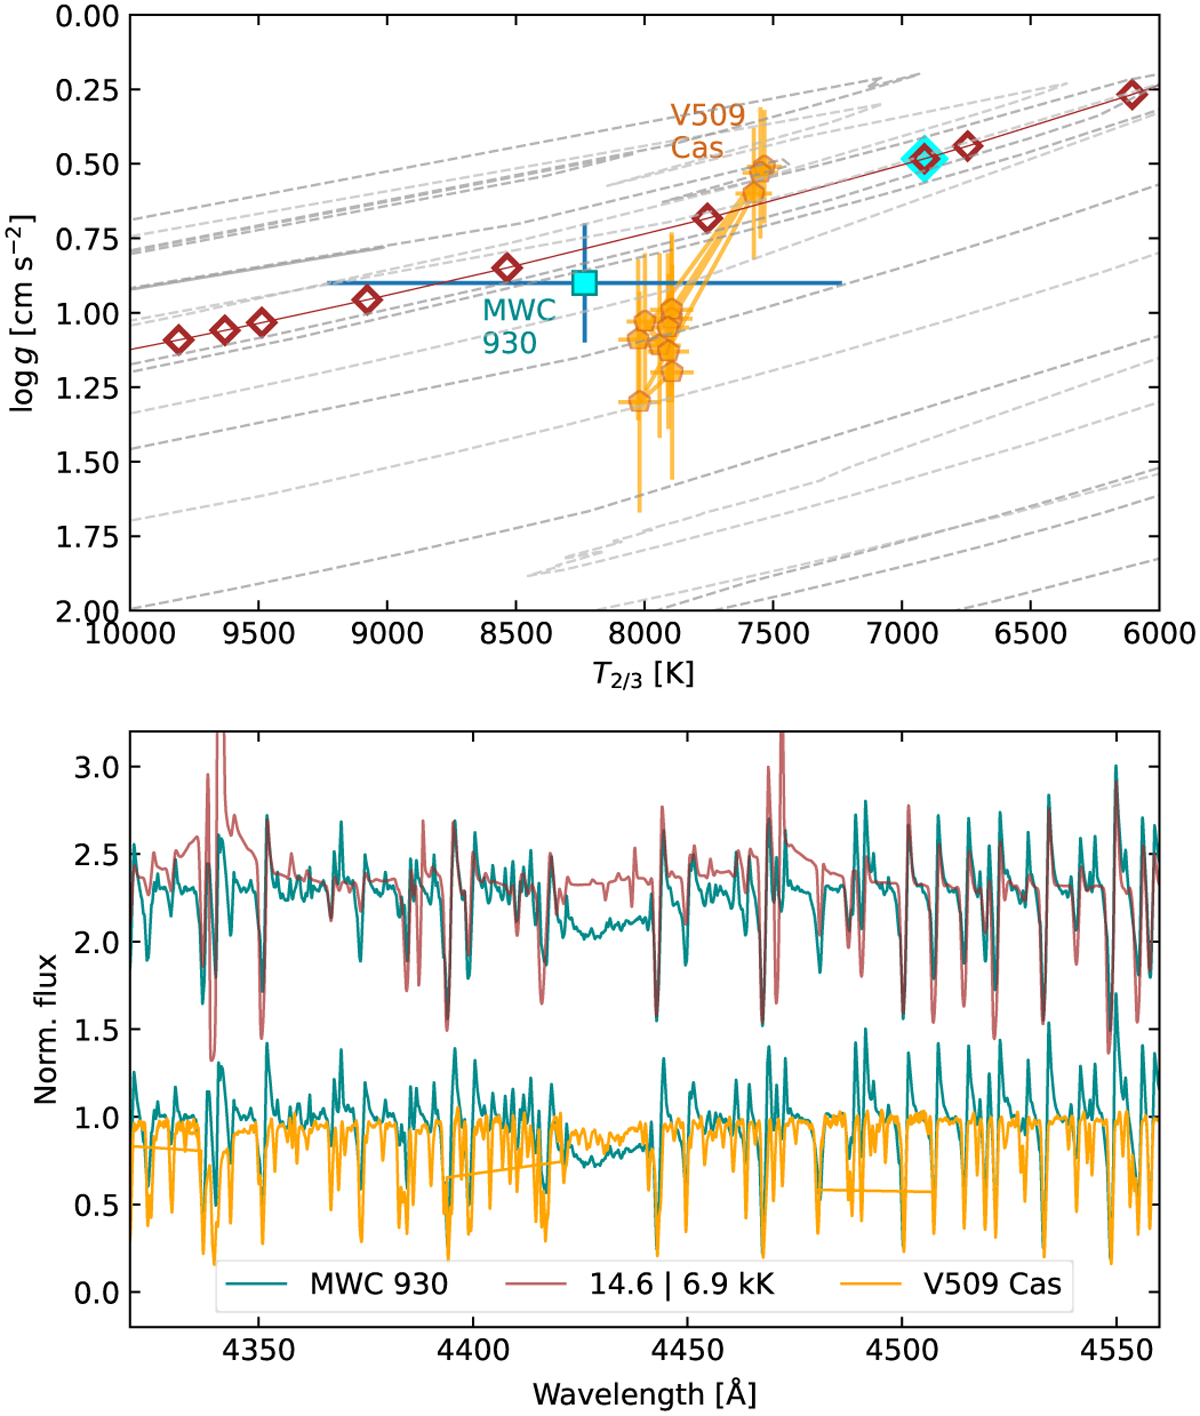
Upper panel: comparison between our model sequence (brown diamonds), MWC 930 at its maximum (Miroshnichenko et al. 2014, cyan square), and the YHG V509 Cas after 2000 (Nieuwenhuijzen et al. 2012, golden pentagons) in the Kiel diagram. The cyan diamond marks the model that resembles MWC 930 best. Lower panel: comparison between the respective spectra. The brown plot shows our model that is most similar to MWC 930, and the golden plot shows the spectrum of V509 Cas in 2012. The spectrum of the LBV is plotted underneath the two as a dark cyan line for comparison. The thin dotted line in the background indicates the tracks of Ekström et al. (2012).
Current usage metrics show cumulative count of Article Views (full-text article views including HTML views, PDF and ePub downloads, according to the available data) and Abstracts Views on Vision4Press platform.
Data correspond to usage on the plateform after 2015. The current usage metrics is available 48-96 hours after online publication and is updated daily on week days.
Initial download of the metrics may take a while.